The Global Impact of Open Data
Singapore's Dengue Cluster Map
Open Data for Public Health
by Andrew Young, David Sangokoya and Stefaan Verhulst*
Dengue Fever
Dengue fever is a viral disease that causes symptoms such as high fever, severe headaches with pain behind the eyes, joint and muscle pain, skin rashes, nausea, vomiting, bruising, and bleeding from the nose or gums. Humans are the natural reservoirs of the dengue virus, of which there are four serotypes, and the disease is spread by the female Aedes mosquitoes, who pick up the virus from infected humans and then further transmit the virus to other humans through its bites.2 The severe form of the disease – dengue haemorrhagic fever – is potentially fatal, particularly for older children and adults with weakened immune systems. This variation of dengue damages the lymph and blood vessels, and can lead to an enlargement of the liver.3
Over 2.5 billion people living in tropical areas are at risk for dengue, and the disease is particularly widespread in the Asia Pacific region, where some 70 percent of the population is considered at risk.4 However, the Centers for Disease Control and Prevention (CDC) found that the reported incidence of dengue is growing across the world, in developed as well as developing countries. The CDC posits that this increase is likely due to a combination of a number of factors, such as population growth, urbanization, lack of sanitation, increased long-distance travel, ineffective mosquito control, and climate change. Improvements in reporting capacity could also play a role in the apparently increasing numbers.5
Dengue’s four different serotypes6 create an added challenge in efforts to address the spread of the disease. Once a patient suffers from dengue, they develop lifelong immunity to that particular serotype of the disease. However, immunity to the other serotype variations is only short-lived, and the risk of developing a more severe version of the disease increases with each subsequent infection by other serotypes.7
There is currently no vaccine or drug to combat dengue, and the principal form of treatment involves intravenous rehydration. The World Health Organization (WHO) reports that about 500,000 people with the severe form of dengue are hospitalized each year, with around 2.5 percent of those people dying. Highlighting the importance of initiatives like the one described here, WHO believes that early detection and medical attention could bring dengue’s fatality rate below 1 percent.8 Individuals armed with an understanding of their level of risk for contracting dengue fever, it would seem, would be far more likely to seek early medical attention – the key factor in improving their chance of survival.
Dengue Fever in Singapore
Dengue has posed a public health challenge to the residents of Singapore since the mid-1960s, when it supplanted malaria as the number one mosquito-borne disease affecting the country. Recent years have witnessed two of the country’s worst epidemics. In 2005, authorities in Singapore confirmed 14,209 cases of dengue, with 25 deaths.9 In 2013, Singapore saw a second major epidemic, with cases rising by more than 50 percent over the 2005 outbreak10 to 22,170.11 These increases are most likely being driven by a combination of greater population density,12 increased international travel, and urbanization. A lower level of immunity throughout the population – the result of long periods of relatively low dengue incidence – has further elevated the risk of transmission. The availability of better and faster diagnostic kits also likely helped to increase the number of reported cases.13
Over time, the Singaporean government has developed a dynamic, evolving dengue control program that seeks to respond to changes in the disease’s epidemiology and to conditions on the ground.14 Authorities have taken an evidence-based integrated approach, coupling virus, mosquito and case surveillance with source reduction – through, among other efforts, the removal of potential mosquito breeding grounds (in the form of standing water in, for instance, flower pot plates and pails) by residents; increasing insecticide fumigation; and penalizing people with a $200 fine if their homes are found to be non-reported mosquito breeding zones within dengue cluster and transmission areas.15
Awareness-building has also played a key role. In April 2013, the National Environment Agency (NEA) launched the “Do the Mozzie Wipeout” campaign, focused on improving public awareness of dengue, inspiring citizens to take preventive actions, and encouraging advocacy over social media and in person.16 The campaign included a variety of innovative communications and outreach components, including home-visits by volunteers to raise awareness; road shows aimed at educating the public; a campaign website and a regularly updated Facebook page.17
Open Data in Singapore
Singapore has an increasingly tech-driven and innovative public and government culture, perhaps in opposition to concerns over civil liberties issues in the nation state – Freedom House labels Singapore as “partly free” with a rating of 4 in civil liberties and political rights.18 In 2009, for instance, the prime minister’s office established the Centre for Strategic Futures, “a think tank within government, with the freedom to focus on issues of strategic importance even if they are not perceived as immediately urgent.”19 The think tank’s initiatives and research have focused on enabling broadly focused dialogue between citizens and the government,20 and arming government employees with the skills and competencies needed to lead in the 21st century.21
As of 2014, the nation’s Internet penetration rate was 78.5 percent according to Internet World Statistics.22 It is considered a “high capacity” country on the Open Data Barometer, albeit at the very bottom of that cluster, with limitations in the areas of political, social and economic impacts, data accessibility, accountability, and citizen and civil society readiness.23 Part of the governmental effectiveness for which Singapore is known, is likely due in part to its relatively small size and keen focus on government-driven efficiency across sectors.
The government’s open data portal (data.gov.sg/) houses data sets from 71 government ministries and agencies, including over 350 data sets related to health originating from the Health Promotion Board, Health Sciences Authority and Ministry of Health. The portal also features a diversity of applications, including many focused on improving public health, such as apps focused on improving citizens’ nutritional intake (Mealplan), sharing government-sponsored sport and fitness activities (Health Friend), and encouraging citizens to stop smoking (Smoke Free @ SG).
Singapore has also used the data portal as a means for catalyzing citizen engagement around available data, through, for example, the Data in the City Visualization Challenge, which asked citizens to tell “your Singapore story using data.”24 The winning entrant, The Singapore Story as told by the Straits Times, visualizes a 170-year-old Singaporean newspaper archive to capture the mood of the era in which the news stories appeared.25
As Professor Ee-Peng Lim, co-director of Living Analytics Research Centre, Singapore Management University, describes, “Singapore is heading toward an effort to use both public and private enterprise data to innovate her economy as well as her society. This is currently the mindset of the government, as well as the nation.”26
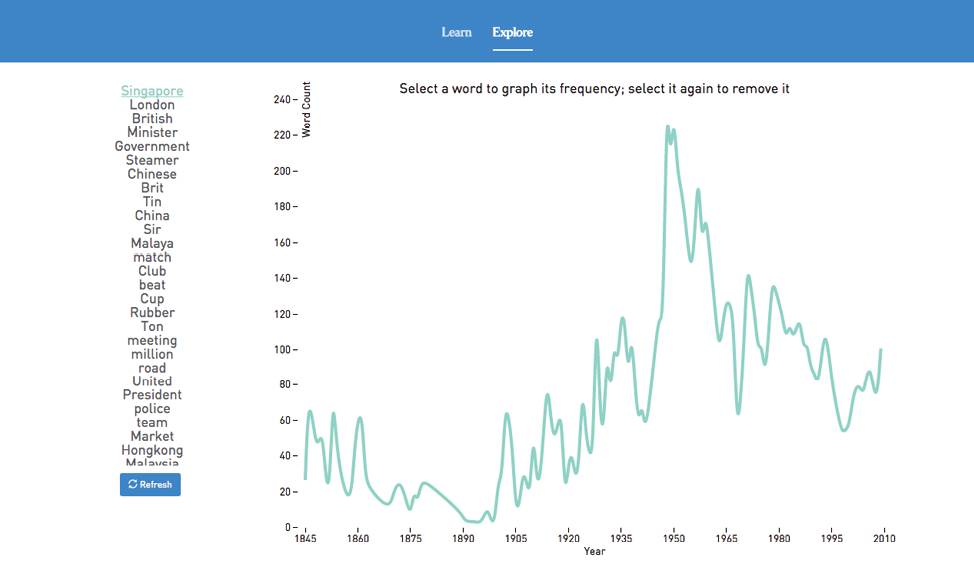
Figure 1. The Singapore Story, winner of the Singaporean Data Visualization Challenge
Read MoreAmong Singapore’s various efforts to combat dengue, the cluster map stands out for its combination of technology with on-the-ground public efforts. The cluster map grew originally out of the 2005 dengue epidemic. In September of that year, the weekly incidence of dengue climbed to over 700, a record high for Singapore.27 As a result, the government began to take more proactive measures to provide information to the public, notably through updates on dengue cases and dengue clusters that were uploaded on the NEA and the Ministry of Health (MOH) websites every day.28 This eventually developed into a website (the “Dengue Website,” as it came to be known, dengue.gov.sg). That website brought together maps and tables from the NEA and MOH sites (along with other information) to build cluster maps that help authorities and the public geographically visualize locations where dengue is a problem. Among other things, these maps help plan vector control operations, inform the public where vector control operations will be carried out, and enable the public in affected areas to take necessary precautions to protect themselves from mosquito bites and help to remove or prevent mosquito breeding areas.
The data used to build the cluster map is gathered from a variety of sources, including medical practitioners who attend or treat dengue cases29 and laboratories that diagnose the disease. Because much of the data is gathered at the individual level, it is anonymized before being uploaded to the site (see note on privacy concerns below). The data is fed into a network that connects the NEA’s headquarters with five satellite offices, as well as the Environmental Health Institute, an NEA-staffed laboratory where investigators conduct research on dengue and GIS modeling as a tool to combat dengue. The dengue cluster map is probably the first instance where the NEA made available to the public on a continuous basis such comprehensive information that was previously only used for internal operational planning30
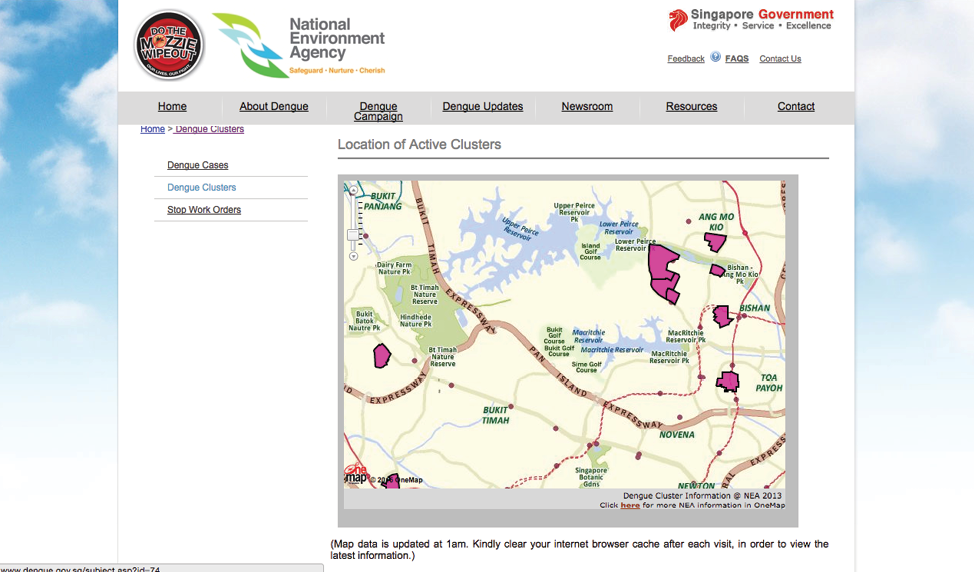
Figure 2. Map of Active Dengue Clusters on the “Dengue Website”
Over the years, the cluster map has changed – and improved – considerably. For example, soon after the website’s launch, it became apparent that a “point map” – a simple map with dots representing affected areas – did not provide a useful level of information to the public. In particular, it provided an inadequate indication of the exact boundaries of dengue clusters, and left some citizens confused about whether or not they resided within a cluster area. As a result, the point map was replaced with a map showing the boundary of each cluster. To complement this, the key breeding habitats detected were also published alongside the dengue clusters.31
In addition, in 2013, following the epidemic mentioned above, a color-coded system was introduced to indicate the severity of an epidemic in a particular cluster. The map was also enhanced to include more granular data, including specific blocks in public housing and road names for private houses. All these enhancements have helped to give the public more specific, actionable information on how to protect themselves from mosquito bites in dengue clusters, and where a high level of vigilance is required in order to combat mosquito breeding.
Community outreach plays a key role in improving the cluster map. Direct outreach to citizens helps the NEA team to identify functionality gaps for the map, ensuring that the tools on offer match the needs of the user base. Perhaps more importantly, direct citizen communication continues to play a large role in supplementing the data housed in the cluster map. Upon receiving dengue case information, the NEA epidemiological officers authorized by the Ministry of Health interview cases to verify case details and learn more about citizens’ usual routines and recent travel history. This information is key for identifying where the mosquito bite leading to infection is likely to have occurred.
Simultaneously, a second group of officers use a predefined algorithm to incorporate the new cases and information obtained from epidemiological investigation into the cluster map and update existing cluster boundary information for daily publishing on the Dengue Website.
Read MoreSince its inception, the Dengue Website has seen significant, sustained use, particularly during the peak dengue season. As indicated by the graph below, the site typically sees between 25,000 and 45,000 monthly visits, with that number rising to almost 100,000 during peak season.
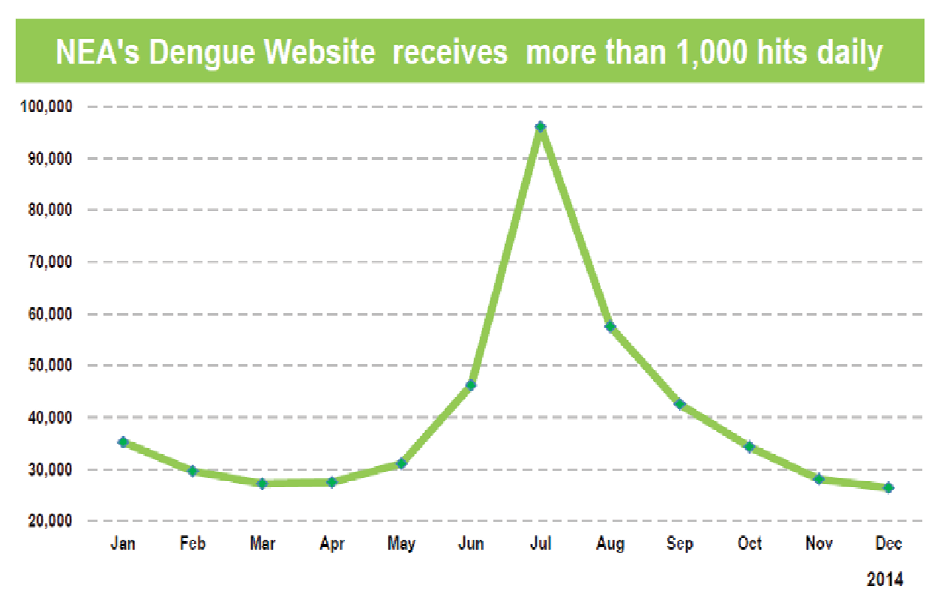
Figure 3. Traffic to the Dengue Website in 2014
It would be a mistake, however, to assess the impact of the site and its maps solely through direct Web traffic. Singapore’s efforts to combat dengue with open data have changed behaviors and attitudes across a variety of different social and demographic groups. It is an important initiative to make information more readily available to the public during this period to urge the public to play a part in dengue prevention and to help curb the dengue transmission.32 The reach of the cluster map has been extended by making it available through NEA’s myENV app for smartphones on various operating platforms. Beyond just a passive aggregator of information, the app has opened up new functionalities for the data behind the cluster map, such as automated user alerts based on user-defined settings and location-based alerts. We consider three impact groups in particular: average citizens, media and developers.
Average Citizens
The largest group of users for the Dengue Website and cluster map is the “Web-savvy public.”33 Given dengue’s potential for rapid transmission, arming the public with information on the areas of active transmission allows the public to take preventive measures against dengue fever, including removal of potential mosquito breeding and wearing insect repellent.34 Prior to the NEA’s concerted effort to give the public this information, there was no surefire way for the public to know the areas of potential active dengue transmission, likely leading to states of either constant vigilance or gradual, learned complacency.
Media
Since the Dengue Website’s inception, journalists have increasingly turned to it for reliable information. According to the NEA, for example, “the mainstream media regularly uses the case count and case breakdown in clusters that are published on the website to report on the prevailing dengue situation, particularly during the peak season.”35 With the importance of open dengue information to the media in mind, since 2014 the NEA has published a brief assessment of the dengue situation each week to go along with the hard data on dengue cases from the previous week, to inform media reports and, subsequently, the public of the situation on the ground.36
Developer Community
One of the more impressive spin-off benefits of the Dengue Website is evident in the galvanization and mobilization of Singapore’s developer community. In recent years, local developers have built a number of Web and mobile applications that build on the data and maps included on the website. Several of these applications improve on the functionality of the the Dengue Website and illustrate open data’s capacity to spur innovation and social and economic development.
Built from raw data sets available through an application programming interface (API) on the Singapore government open data portal, developers have created applications built using this API, in addition to the myENV app created by the NEA itself. Two of the most popular are:
- DengueLah, created by Buuuk, a mobile app development agency, tells the user where dengue active clusters are and, using location awareness, alerts the user if he or she approaches within a 2km radius of a known dengue cluster. The app also has a page with tips for prevention against dengue infection, illustrated with cartoons.
- X-Dengue, created through a collaboration between the NEA and Smart Communities Pte Ltd, a local software development company, alerts users on dengue clusters through location-based SMS and email alerts. Users can also check if their current location is considered to be at risk. The accompanying Web portal allows users to update danger zones that are then broadcast through the app.37 X-Dengue has since been discontinued, with many users lamenting the loss of the platform on its Facebook page. “All the best!” one user writes, “You’ve helped lots of people across SG with your community spirit!”38
Reference
1 Special thanks to Akash Kapur who provided crucial editorial support for this case study, and to the peer reviewers [odimpact.org/about] who provided input on a pre-published draft.
2 “Dengue.” World Health Organization. http://www.who.int/topics/dengue/en/.
3 Associated Press. “Singapore on alert after dengue fever cases rise.” The Independent. June 11, 2013. http://www.independent.co.uk/life-style/health-and-families/health-news/singapore-on-alert-after-dengue-fever-cases-rise-8654478.html.
4 “Dengue.” World Health Organization. http://www.who.int/topics/dengue/en/.
5 “Dengue and Climate.” Centers for Disease Control and Prevention. http://www.cdc.gov/Dengue/entomologyEcology/climate.html.
6 A serotype is a “group of intimately related microorganisms distinguished by a common set of antigens.” Merriam-Webster Medical Dictionary. http://www.merriam-webster.com/medical/serotype.
7 “Host Response to the Dengue Virus.” Scitable by Nature Education. http://www.nature.com/sqcitable/topicpage/host-response-to-the-dengue-virus-22402106.
8 Wong, Chun Han. “Dengue Fever on the Rise in Singapore.” The Wall Street Journal. April 29, 2013. http://www.wsj.com/articles/SB10001424127887324743704578446162122159222.
9 Wong, Chun Han. “Dengue Fever on the Rise in Singapore.” The Wall Street Journal. April 29, 2013. http://www.wsj.com/articles/SB10001424127887324743704578446162122159222.
10 GovLab Interview with the National Environment Agency of Singapore, July 23, 2015.
11 “Fact Sheet on Managing Singapore’s Dengue Outbreak.” National Environment Agency of Singapore. March 11, 2014. http://www.nea.gov.sg/docs/default-source/corporate/COS-2014/managing-singapore’s-dengue-outbreak.pdf.
12 According to the World Bank, Singapore had a population density of 7,814 people per square kilometer in 2014, making it the third-densest country in the world. Source: “Population density (people per sq. km of land area).” World Bank Data. http://data.worldbank.org/indicator/EN.POP.DNST?order=wbapi_data_value_2014+wbapi_data_value+wbapi_data_value-last&sort=desc.
13 GovLab Interview with the National Environment Agency of Singapore, January 22, 2016.
14 GovLab Interview with the National Environment Agency of Singapore, July 23, 2015.
15 Tiong, Sabrina. “NEA officers fanning out in dengue hot spots.” AsiaOne. March 31, 2013.
16 GovLab Interview with the National Environment Agency of Singapore, July 23, 2015.
17 https://www.facebook.com/Stop.Dengue.Now?fref=ts
19 Centre for Strategic Futures. “Foresight.” 2014. http://www.csf.gov.sg/docs/default-source/default-document-library/csf-report-2014.pdf.
20 Kuah, Adrian W.J. and Lim Seok Hui. “After Our Singapore Conversation: The Futures of Governance.” Singapore Civil Service College. June 2014. https://www.cscollege.gov.sg/Knowledge/ethos/Ethos%20-%20Issue%2013,%20June%202014/Pages/After%20Our%20Singapore%20Conversation%20The%20Futures%20of%20Governance.aspx.
21 Wei, Leong Ming. “Developing Talents in Futures.” in Foresight. 2014. http://www.csf.gov.sg/docs/default-source/default-document-library/csf-report-2014.pdf.
25 http://singaporenews.github.io/
26 GovLab interview with Professor Ee-Peng Lim, Ph.D., Co-Director, Living Analytics Research Centre, Singapore Management University, September 28, 2015.
27 GovLab Interview with the National Environment Agency of Singapore, July 23, 2015.
28 The NEA defines a dengue cluster as “a locality with active transmission where intervention is targeted. It is formed when two or more cases have onset within 14 days and are located within 150m of each other (based on residential and workplace addresses as well as movement history).” GovLab Interview with the National Environment Agency of Singapore, July 23, 2015.
29 Under the Infectious Diseases Act, Cap. 137, every medical practitioner is required to notify the Director of Medical Services (Ministry of Health) not later than 24 hours from the time of diagnosis of dengue fever/dengue haemorrhagic fever.
30 GovLab Interview with the National Environment Agency of Singapore, August 31, 2015.
31 GovLab Interview with the National Environment Agency of Singapore, July 23, 2015.
32 GovLab Interview with the National Environment Agency of Singapore, August 31, 2015.
33 GovLab Interview with the National Environment Agency of Singapore, July 23, 2015.
34 GovLab Interview with the National Environment Agency of Singapore, August 31, 2015.
35 GovLab Interview with the National Environment Agency of Singapore, July 23, 2015.
36 GovLab Interview with the National Environment Agency of Singapore, July 23, 2015.
37 “Dengue on the Rise – Some Apps to Stay Informed on Dengue Clusters.” Iheartapple. http://iheartapple.com/2013/01/dengue-on-the-rise-some-apps-to-stay-informed-on-dengue-clusters/.
39 GovLab Interview with the National Environment Agency of Singapore, July 23, 2015.
40 GovLab interview with Professor Ee-Peng Lim, Ph.D., Co-Director, Living Analytics Research Centre, Singapore Management University, September 28, 2015.
41 GovLab Interview with the National Environment Agency of Singapore, July 23, 2015.
42 Xu, Terry. “App site tracks dengue cases in Singapore using Google Maps.” The Online Citizen. July 30, 2014. http://www.theonlinecitizen.com/2014/07/app-site-tracks-dengue-cases-in-singapore-using-google-maps/
43 Xu, Terry. “App site tracks dengue cases in Singapore using Google Maps.” The Online Citizen. July 30, 2014. http://www.theonlinecitizen.com/2014/07/app-site-tracks-dengue-cases-in-singapore-using-google-maps/
44 GovLab Interview with the National Environment Agency of Singapore, July 23, 2015.
46 “Potential dengue vaccine protects those aged 9 and above: Study.” Your Health Asia One. August 4, 2015. http://yourhealth.asiaone.com/content/potential-dengue-vaccine-protects-those-aged-9-and-above-study