The Global Impact of Open Data
United States' New York City Business Atlas
Leveling the Playing Field
by Andrew Young, David Sangokoya and Stefaan Verhulst*
In recent years there has been growing recognition that urban life is being transformed by data. From Chicago to London to Singapore, city administrators and planners are turning to data to help plan the future and address mundane, everyday issues like potholes and waste collection. Underlying such trends is an awareness of the vast amounts of data being generated (often passively) in urban centers, through devices like smartphones and sensors. In the words of The Economist magazine, cities today are “open air computers” and “data factories.”3
In 2002, Michael Bloomberg assumed office as the 108th mayor of New York City. Bloomberg had made his fortune providing data and sophisticated analytics to financial traders. It was probably inevitable that, under his administration, New York would join the many cities around the world seeking to extract greater value from the terabytes of data being created every day by their citizens.
In 2013, through Executive Order No. 306, New York City created the Mayor’s Office of Data Analytics (MODA).4 The stated goal of the office was “leveraging City data for more effective, efficient, and transparent government.”5 Today the office comprises a team of analysts, based in City Hall, who collect and analyze data from a wide variety of sources. Among other areas, MODA works on crime prevention, disaster response, improving public services, and economic development. MODA also played a key role in setting up New York’s Open Data Portal (https://nycopendata.socrata.com), which currently houses over 12,000 data sets related to health, business, public safety and much more. In addition, MODA helped establish DataBridge, a single, unified repository of information that aims to enhance data sharing and interoperability among various NYC organizations.6 In July 2015, the city released its updated “Open Data for All” strategy document, which focuses on two central “beliefs”: that every New Yorker can benefit from open data; and that open data can benefit from every New Yorker.7
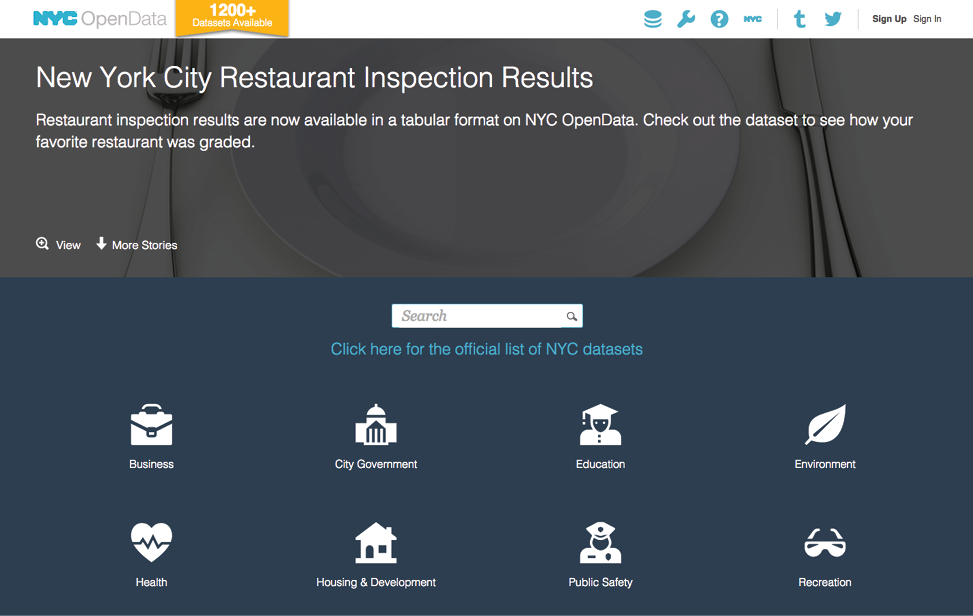
Figure 1. New York City’s Open Data Portal
Because of these and other efforts, New York City is generally considered a leader in open data initiatives in the United States (itself the second-ranked country on the Open Data Barometer).8 MODA, in particular, is a pioneering and increasingly emulated entity in the open data ecosystem. It has played an important role not only in releasing open data to increase accountability and innovation, but also in doing analytical work on that data. This work includes measuring the efficiency of city services, providing data-driven predictions and, as with the Business Atlas, combining high-value data sets from a diversity of sources to provide new insights and visualizations to government agencies and the public.
MODA’s analytics efforts, led at the time of writing by New York City’s Chief Analytics Officer, Dr. Amen Ra Mashariki, are deployed to aid disaster response and recovery, improve delivery of city agencies and services, enable data sharing among city agencies, crystallize best practices in data analysis and, as evidenced in the case described here, spur economic development.9
Within these domains of focus and types of analytical work, MODA subscribes to four central, overarching goals: improving awareness, measuring success, maximizing impact and increasing engagement.10
Mike Flowers, Mashariki’s predecessor and the first New York City chief analytics officer, described the integral role played by MODA in the city’s data operations in an annual report released after MODA’s first year of operations: “Over the last three terms, our agencies have developed information systems that they use to make our streets safer, our businesses vibrant, and our parks cleaner. Through a blend of statistical analysis, engineering skills, and deep investigation of the missions and organizational structure of the agencies – the why, what and how of city government – MODA ties these systems together, enabling the City to tap into our collective knowledge and experience to tackle our thorniest challenges.”11
According to MODA officials, its mission and projects are focused on the “thorny” challenges at hand for New Yorkers while its efforts are using new analytical capabilities. Lindsay Mollineaux, director of analytics at MODA, for instance, notes that, “[Addressing real need] is very much how we think about things at MODA – every project is addressing need. We want to make sure what we’re doing is useful.”12
Read MoreThe New York City Business Atlas, initiated in 2013, is part of a broader effort by MODA aimed at “driving small business growth with analytics.”13 This broader effort also includes the Comprehensive Business Census, which arose in the aftermath of Superstorm Sandy, when the city struggled to assess the storm’s full impact on businesses and the economy. Before MODA began working in this area, there existed no comprehensive record of businesses in the city. MODA sought to fill this information gap by working with PLUTO, a database of land use and geographic data, to assemble a more “complete picture” of businesses and business activity in New York City.
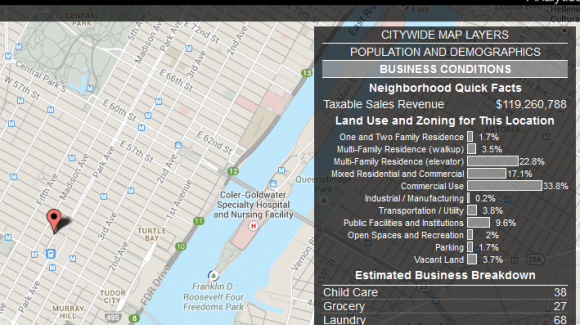
Figure 2. New York City Business Atlas with Business Conditions Sidebar
The New York City Business Atlas grew out of a recognition among city officials that, when it comes to data, large businesses often have an edge over smaller ones. While large businesses can afford to hire expensive consultants and commission data-driven research, smaller businesses must rely on “gut feeling” to make important business decisions, such as where to open a new location or how to navigate regulatory challenges. Mike Flowers explains the advantages held by large businesses as follows: “In many parts of Manhattan, you can’t swing a dead cat without hitting a Starbucks. Those guys have robust infrastructure, capacity to help them figure out two things: a) where to open up in the first place; and b) the piece of this about navigating the regulatory challenges of opening a place.”14 He adds that, for small businesses in particular, data paucity is a “chronic” problem, and “probably [has] been chronic since Emperor Augustus was trying incentivize small business in Rome.”15
Though followed by a number of twists and turns, work on the Business Atlas began following a discussion within MODA on how small business owners often feel under siege from the city government, rather than supported by it. Flowers noted that the city restaurant rating system, which assigns letter grades to restaurants based on their compliance with health regulations, tends to benefit large chains and restaurants, which typically have “the wherewithal and institutional experience and institutional resources to bake into their infrastructure code compliance.”16 The Business Atlas represents a pivot away from the specific inspiration regarding code compliance, but remains in line with the focus on arming small business owners with new tools to compete with bigger chains.17
In the words of John Feinblatt, chief policy adviser to Mayor Bloomberg, the Business Atlas “democratizes” information, “putting quality research into the hands of small business owners.”18 It is important to note that much (but not all) of the data included in the Business Atlas already existed – for example, through the city’s open data portal – and was theoretically at least available to small business owners. As noted, however, it was often in fragmentary form, and without the sophisticated analytics and visualization layer contained within the Business Atlas, both of which make the data far more accessible and useful for entrepreneurs. To use the tool, businesspeople visit maps.nyc.gov/businessatlas, and select a neighborhood. The data pulled up by the app includes population, population distribution by age, median household income, how many households have children, homeowners vs. renters, and much more specific to that neighborhood. Not only is the Business Atlas itself free to use, but users can also sign up for free training sessions, held in city business centers, that will help them derive the most from the tool.19
One of the platform’s most important pieces of data is the foot traffic in various neighborhoods. To collect this information, New York partnered with a local startup, Placemeter, a self-styled “urban intelligence platform.”20 Placemeter uses cameras (including existing municipal street traffic cameras and sensor-laden IP cameras) to assess population movement through neighborhoods. The resulting information includes both pedestrian and vehicular traffic data. While much of the analytical work is done algorithmically, Placemeter also relies on humans to analyze videos and perform random quality checks of the work being done by the algorithms.21 The resulting data gives businesspeople an indication of prospective customer numbers, thus helping guide location-relevant business decisions.22 The city also has plans to supplement the data using crowdsourced information. Although an important piece of the Business Atlas, Placemeter’s work on quantifying public spaces could lead to privacy concerns directed at the city down the road. That said, Placemeter has taken concrete steps to mitigate those concerns by: a) processing video in real time so that less than 0.01 percent of all video is recorded or stored – and only for processing and quality assurance purposes; and b) only providing anonymized counts of pedestrians, with no specific identities attached. Former U.S. Deputy Chief Technology Officer Nicole Wong also acts as a privacy adviser to the company.23
In addition to Placemeter data, the Atlas includes data pulled from a variety of government departments and agencies. These include the Department of Consumer Affairs, the Department of Finance (e.g., sales tax information), and demographic data from census results. The Atlas supplements this data with information shared from the Department of Health and Mental Hygiene (DOHMH), Business Integrity Commission (BIC), Department of Environmental Protection (DEP), Department of City Planning (DCP) and Department of Buildings (DOB) in New York City, as well as state and national open data.24 In many cases, MODA’s task involved combining and analyzing data sets that were already open and accessible to the public. In other cases, additional effort was required from MODA in order to secure the release of data. Sales tax data from the Department of Finance, for example, is protected due to the inclusion of personally identifiable information. In order to include the data in the Atlas, MODA first had to strip away personal information through an anonymization process.25
“Some of the needed data in designing the Atlas was obvious to us, but the question was what is useful to entrepreneurs versus information overload?”
In order to combine all this data in a single place, the team creating the Atlas had to overcome several technical and conceptual challenges. For example, while as much data as possible was pulled from the city’s DataBridge (described above), there were inevitable issues concerning the compatibility of data sets. Differences between data standards and formats create a major and time-consuming challenge in the effort to combine multiple data streams into one usable tool. In addition, finding accurate data for local businesses proved more challenging than anticipated. As Mollineaux explained, each industry has its own particular licensing regulations (and some businesses, for example bookstores, have no licensing requirements at all), making it difficult to accurately represent and synthesize local business information across sectors.26
User-Centered Design and Partnering with Department of Small Business Services
Although the general value proposition of the NYC Business Atlas was clear from the outset, MODA decided to partner with the New York City Department of Small Business Services (SBS) to ensure that the needs of small businesses (its target audience) were truly met. As Mollineaux noted: “Some of the needed data in designing the Atlas was obvious to us, but the question was what is useful to entrepreneurs versus information overload? SBS served as our subject matter experts who interfaced with actual entrepreneurs (for example, people might come to them about opening a bakery) and could use the Atlas to directly serve these needs. ... We always partner with client agencies who are subject matter experts and can help define what success looks like.”27
Through ethnographic research and interviews, SBS was able to help MODA determine what was most relevant for various types of users. For example, MODA originally focused on displaying some of the business and demographic information as a score for a given geographic location. User feedback, gathered with the assistance of SBS, helped MODA to recognize that, in fact, entrepreneurs would be more interested in less-aggregated data; most businesspeople wanted the underlying data rather than a one-size-fits-all score.28 Rather than a simple score or grade, therefore, the data is now mapped in a disaggregated, “raw” form, allowing users to draw their own conclusions.
In addition to partnering with SBS to supplement the informational base of the platform, MODA partnered with the New York City library system to drive use. Research had indicated to Flowers and his team that many entrepreneurs rely on their local library to gain insight into how to start a new business. With this audience of potential users in mind, MODA worked with and trained library staff to introduce the platform to potential entrepreneurs and essentially serve as “small business counselors.”29
Overall, MODA’s approach of partnering with different agencies and institutions has proven remarkably fruitful. According to Flowers, it is part of a well-thought-out strategy to ensure the longevity of the Business Atlas. As Flowers puts it: “You have to get the civil service on board. … If you don’t have them on board as major participants, then in the next election everything you worked on is gone.”30
Read MoreReference
2 Verhulst, Stefaan and David Sangokoya. “Data Collaboratives: Exchanging Data to Improve People’s Lives,” Medium, April 22, 2015. https://medium.com/@sverhulst/data-collaboratives-exchanging-data-to-improve-people-s-lives-d0fcfc1bdd9a.
3 "Open-air Computers," The Economist, October 27, 2012. Accessed July 14, 2015. http://www.economist.com/news/special-report/21564998-cities-are-turning-vast-data-factories-open-air-computers.
4 Exec. Order No. 306, 3 C.F.R. (2013), http://www.nyc.gov/html/om/pdf/eo/eo_306.pdf.
5 Flowers, Michael. “NYC by the Numbers Annual Report.” New York City Government. December 2013. http://www.nyc.gov/html/analytics/downloads/pdf/annual_report_2013.pdf.
6 Yasin, Rutrell. “How analytics is making NYC’s streets and buildings safer.” GCN, October 4, 2013. http://gcn.com/articles/2013/10/04/gcn-award-nyc-databridge.aspx.
7 “Open Data for All” New York City Government. 2015. http://www1.nyc.gov/assets/home/downloads/pdf/reports/2015/NYC-Open-Data-Plan-2015.pdf
9 Flowers, Michael. “NYC by the Numbers Annual Report.” New York City Government. December 2013. http://www.nyc.gov/html/analytics/downloads/pdf/annual_report_2013.pdf.
10 “NYC MODA Presentation Federal Summit.” New York City: NYC Analytics, February 2015. http://lnwprogram.org/sites/default/files/NYC_MODA_Presentation_Federal_Summit.pdf
11 Flowers, Michael. “NYC by the Numbers Annual Report.” New York City Government. December 2013. http://www.nyc.gov/html/analytics/downloads/pdf/annual_report_2013.pdf.
12 GovLab interview with Lindsay Mollineaux, Director of Analytics, Mayor’s Office of Data Analytics, New York City, July 2, 2015.
13 Flowers, Michael. “NYC by the Numbers Annual Report.” New York City Government. December 2013. http://www.nyc.gov/html/analytics/downloads/pdf/annual_report_2013.pdf.
14 GovLab interview with Mike Flowers, former Chief Analytics Officer, Mayor’s Office of Data Analytics, New York City, August 14, 2015.
15 GovLab interview with Mike Flowers, former Chief Analytics Officer, Mayor’s Office of Data Analytics, New York City, August 14, 2015.
16 GovLab interview with Mike Flowers, former Chief Analytics Officer, Mayor’s Office of Data Analytics, New York City, August 14, 2015.
17 In a separate initiative, MODA is collaborating with the New York City Small Business Services “to reduce the regulatory burden on small businesses in New York City” by sending “trained client managers to neighborhoods across the five boroughs to provide business owners with targeted education informed by data showing the specific needs in a given neighborhood – including top violations, areas of noncompliance, new business growth data, 311 complaints, and more.” “Small Business Services Launches Proactive Education and Outreach Efforts to Help Ease Regulatory Burden on New York City Small Businesses.” New York City Small Business Services. May 27, 2015. http://www.nyc.gov/html/sbs/html/pr/2015_05_27_SB1.shtml
18 Schweidel, D. A. Profiting from the data economy: Understanding the roles of consumers, innovators, and regulators in a data-driven world (Upper Saddle River, NJ: Pearson Education).
19 Furman, Phyllis. “Map this! New city tech tool lets small businesses compete with the big guys by dishing data.” New York Daily News. December 16, 2013. http://www.nydailynews.com/new-york/map-new-city-tech-tool-lets-small-businesses-compete-big-guys-dishing-data-article-1.1559044
20 GovLab interview with Florent Peyre, Chief Operating Officer and Co-Founder, Placemeter, August 19, 2015.
21 GovLab interview with Florent Peyre, Chief Operating Officer and Co-Founder, Placemeter, August 19, 2015.
22 "Platform - How It Works." Placemeter. https://www.placemeter.com/platform
23 “Privacy by Design.” Placemeter. http://www.placemeter.com/privacy
24 “NYC MODA Presentation Federal Summit.” New York City: NYC Analytics, February 2015. http://lnwprogram.org/sites/default/files/NYC_MODA_Presentation_Federal_Summit.pdf
25 GovLab interview with Mike Flowers, former Chief Analytics Officer, Mayor’s Office of Data Analytics, New York City, August 14, 2015.
26 GovLab interview with Lindsay Mollineaux, Director of Analytics, Mayor’s Office of Data Analytics, New York City, July 2, 2015.
27 GovLab interview with Lindsay Mollineaux, Director of Analytics, Mayor’s Office of Data Analytics, New York City, July 2, 2015.
28 GovLab interview with Lindsay Mollineaux, Director of Analytics, Mayor’s Office of Data Analytics, New York City, July 2, 2015.
29 GovLab interview with Mike Flowers, former Chief Analytics Officer, Mayor’s Office of Data Analytics, New York City, August 14, 2015.
30 GovLab interview with Mike Flowers, former Chief Analytics Officer, Mayor’s Office of Data Analytics, New York City, August 14, 2015.
31 Neubauer, Miranda. “With Business Atlas, NYC Analytics Office Looks to 2014.” TechPresident. January 2, 2014. http://techpresident.com/news/24635/business-atlas-nyc-analytics-office-looks-2014
32 Krasny, Jill. “NYC Data Tool Gives Small Business an Edge.” Inc. December 27, 2013. http://www.inc.com/jill-krasny/nyc-business-atlas-helps-small-businesses.html
33 “Towards Data Driven Cities? Meet up with Chief Data Officers.” Proceedings of La Fabrique De La Cite, Paris. March 23, 2015. http://www.lafabriquedelacite.com/fabrique-de-la-cite/data.nsf/FDD3CB2E8CEA41D2C1257E0F00324482/$file/actes_cdo_02062015_def_web.pdf.
34 New York City Department of Small Business Services. “Starting a Business Improvement District: A Step-by-Step Guide.” Nyc.gov. 2003. http://www.nyc.gov/html/sbs/downloads/pdf/bid_guide_complete.pdf.
35 “Towards Data Driven Cities? Meet up with Chief Data Officers.” Proceedings of La Fabrique De La Cite, Paris. March 23, 2015. http://www.lafabriquedelacite.com/fabrique-de-la-cite/data.nsf/FDD3CB2E8CEA41D2C1257E0F00324482/$file/actes_cdo_02062015_def_web.pdf.
36 GovLab interview with Mike Flowers, former Chief Analytics Officer, Mayor’s Office of Data Analytics, New York City, August 14, 2015.
37 “FireCast: Leveraging Big Data for Mitigating Fire Risks.” The Innovation Enterprise. January 22, 2014. https://ieondemand.com/divisions/big-data/events/4/presentations/firecast-leveraging-big-data-for-mitigating-fire-risks#sthash.FidXBzgc.dpuf.
38 Yasin, Rutrell. “How analytics is making NYC’s streets and buildings safer.” GCN, October 4, 2013. http://gcn.com/articles/2013/10/04/gcn-award-nyc-databridge.aspx.
39 Flowers, Michael. “NYC by the Numbers Annual Report.” New York City Government. December 2013. http://www.nyc.gov/html/analytics/downloads/pdf/annual_report_2013.pdf.
41 Coepland, Eddie. “Big Data in the Big Apple.” Capital City Foundation. 2015. http://capitalcityfoundation.london/big-data-in-the-big-apple-web-version/.
42 Flowers, Mike and Lauren Talbot. “Building a Gov Data Skunkworks.” Code for America. February 18, 2014. http://www.codeforamerica.org/peer-network-training/02-18-2014/.
43 GovLab interview with Mike Flowers, former Chief Analytics Officer, Mayor’s Office of Data Analytics, New York City, August 14, 2015.
44 GovLab interview with Mike Flowers, former Chief Analytics Officer, Mayor’s Office of Data Analytics, New York City, August 14, 2015.
45 GovLab interview with Lindsay Mollineaux, Director of Analytics, Mayor’s Office of Data Analytics, New York City, July 2, 2015.
46 GovLab interview with Mike Flowers, former Chief Analytics Officer, Mayor’s Office of Data Analytics, New York City, August 14, 2015.
47 Flowers, Michael. “NYC by the Numbers Annual Report.” New York City Government. December 2013. http://www.nyc.gov/html/analytics/downloads/pdf/annual_report_2013.pdf.
48 Flowers, Michael. “NYC by the Numbers Annual Report.” New York City Government. December 2013. http://www.nyc.gov/html/analytics/downloads/pdf/annual_report_2013.pdf.
49 Flowers, Michael. “NYC by the Numbers Annual Report.” New York City Government. December 2013. http://www.nyc.gov/html/analytics/downloads/pdf/annual_report_2013.pdf.
50 GovLab interview with Florent Peyre, Chief Operating Officer and Co-Founder, Placemeter, August 19, 2015.
51 “Open Data for All” New York City Government. 2015. http://www1.nyc.gov/assets/home/downloads/pdf/reports/2015/NYC-Open-Data-Plan-2015.pdf