The Global Impact of Open Data

United Kingdom's Transport for London

Get set, go!

by Becky Hogge

Impacteconomic

Sectortransportation

LocationUK

Read Time

Brief View 8 MINS

Full Story 24 MINS

Transport for London (TfL) was a cautious entrant into the open data fold. But now, five years after beginning to release its key datasets, many in real time, the apps built on the back of its data number in the hundreds, reach millions of London transport users and deliver tens of millions in monetised time savings to its core customer base, all for relatively low investment. Open data thinking is now “embedded” in the organisation, and TfL’s experience with open data has led to other national transport authorities following in their footsteps.

Read More
  • Transport data is very amenable to the open data approach. The market for developing apps based on transport data is highly responsive.
  • TfL was a cautious entrant to the open data fold. The decision to open TfL’s data was in large part an experimental one, since the business case for open data was hard to model. The risk paid off: TfL is now converted to open data, and has been able to demonstrate the benefits of an open data policy to other stakeholders in the field who may never have been in a position to take the initial leap of faith themselves.
  • TfL knew its customers increasingly wanted to access information about transport services across a wide variety of smartphone platforms. This was a key factor in the decision to move to open data, since the alternative—developing apps in-house that served every smartphone platform—would have been an expensive undertaking.
  • Innovation in the transport apps market may slow once personal data becomes a more important part of the mix. Apps like Google Now have the potential to lock users in to transport data-based services thanks to location data Google collects that will be unavailable to competing providers. At the same time, TfL is developing smartphone services that include a payment element and therefore must be developed in-house to keep users’ payment details secure.
Read More

Number of developers registered on TfL website: >5,000

Number of apps available powered by TfL data: 362

Reach of apps powered by TfL data: ~4 million people

Value of time saved by users of these apps in 2012: £15m-£58m

Read More

“You couldn’t prove in advance what making the data open was going to lead to. So eventually what we decided was we’d just go for it and see what would happen.”

Vernon Everitt, TfL

“TfL have come on a tremendous journey”

Emer Coleman, Greater London Authority/TransportAPI.

Read More

Transport for London (TfL) is the local government body responsible for implementing transport strategy and managing transport services across the UK capital. It oversees almost all aspects of transport in Europe’s largest city1, with 24 million journeys made across London’s transport network every day.2

As well as managing London’s buses, the Tube network, Docklands Light Railway, Overground, and Tramlink, it runs the city’s cycle hire scheme, its River Services, coach station, and the Emirates Air Line cable cars that cross the River Thames to the east of the city at Greenwich. It controls the city’s 6,000 traffic lights and a 580km network of main roads. It regulates London’s taxis and private hire vehicles, and runs the city’s Congestion Charge scheme.3

TfL is part of the Greater London Authority (GLA). It is publicly owned, and is governed by a Board of Directors chaired by London’s mayor. It is funded by “farepayers and taxpayers”4
. In 2014/15, nearly half (47%) of its £10.9bn funding was derived from fares and other income (e.g., the Congestion Charge). A quarter (25%) was from grant funding via the UK’s Department for Transport and the GLA, and the remainder was made up of borrowing, cash movements, and Crossrail funding.5

TfL enjoys a reputation as an innovator in the field of transport services, and the scale of its operations means early investment in new technology often makes good business sense.6

Read More

TfL makes available 62 separate datasets.7 These are a mix of real-time feeds (such as Tube departure boards, live traffic disruption, live bus arrivals, and TfL’s Journey Planner API), fixed datasets (such as timetables, station locations, and station facilities) and transparency-oriented datasets (detailing operational performance, directors’ remuneration, etc.).

2007

Launch of embeddable “widgets” for live travel news, map and Journey Planner.

2009

Special area for developers launched on TfL website.

2010

London Datastore launched. Additional real-time feeds launched with hundreds of developers registered.

2011

London Underground train location and Journey Planner APIs launched. Registered developers rise to over 1,000.

2012

Live bus arrivals API launched, full London 2012 Olympic and Paralympic Games transport data portal. Over 4,000 developers registered.

2013

Over 5,000 developers, 30 data feeds, hundreds of apps on the market serving millions of customers. New accessibility and roads feeds added.

Figure 1: Timeline of TfL data releases.

TfL requires data re-users to register with them in order to access any of their data. During the registration process, users agree to a set of licensing terms that, while based on version 2.0 of the Open Government Licence, contain some important additional conditions.8 As well as setting fairly reasonable limits on the demand (number of calls) any one user can make on the data APIs, these conditions coalesce around protecting TfL’s branding and not passing off any products created as official TfL products. Users must also give TfL accurate information about their intended use of the data before being granted access to it. In this respect the data released by TfL does not conform to the open definition. Nonetheless, internally and externally, TfL refer to it as “open data”, as do observers in general. When questioned on this point, Phil Young, head of TfL Online, responded:

As far as developers are concerned, I think they would consider it to be open data unless they’re particularly narrow in their view of what they think that open data is. Really [what we stipulate is] incredibly light, and the fact that we probably get more developers working on our stuff, and more apps created on our stuff, than anywhere else possibly in the world, would suggest that it’s … fairly open.9

TfL’s website specifies how regularly each data feed is updated, ranging from every 30 seconds (Tube departure boards) to annually (London Underground Passenger Counts data). The TfL data offer attempts to exclude any form of personal information. Nonetheless, one dataset did appear to pose a privacy risk: In April 2014 software engineer James Siddle demonstrated how cycle hire use statistics connected to Customer IDs could theoretically be de-anonymised in the presence of “any seemingly innocuous personal signal” (such as a Foursquare check in, Facebook post, picture, or tweet linking an individual to a cycle hire location), leading to the exposure of “a detailed record [of] someone’s life in London”10. TfL said that including Customer IDs in the data had been an administrative error11. They have since been removed.

Read More

TfL’s journey to open began in 2007, when the development team, led by Phil Young, released a set of embeddable widgets. These “code snippets” allowed users to integrate TfL online products like live travel updates into popular web content aggregator services like NetVibes and iGoogle, as well as custom-designed websites. The releases were part of a strategy to encourage customers to check the status of London Underground lines at weekends, as the network was undergoing an intense program of improvement works. Discussing his team’s motivation to develop embeddable widgets in 2007, Phil Young points to trends among other data teams working in the public service space, and specifically BBC Backstage, a now defunct developer network co-founded by Tom Loosemore (who, as a former trustee of UK Citizens Online Democracy, the charity that runs mySociety, is a key player in another open data project profiled in this report), that had begun to experiment with releasing the BBC’s scheduling data:

We never really engaged with the BBC on it, but we were observing what was going on. We were a small digital team of keen developers, so we were just as interested in this world as everyone else, and the things that could be done. And we quickly saw that our data was probably more interesting than [the BBC’s] data.12

In 2009, recognising that web developers wanted TfL to go further, Phil Young and his team launched a dedicated area on the TfL website for web developers13. A timeline of TfL’s data releases is given in Figure 1. Vernon Everitt, Managing Director in charge of Customer Experience, Marketing and Communications and TfL’s open data champion, describes the journey so far thus:

Between 2007 and 2010 we were feeling our way a bit. And then by 2011 we’d got the hang of it and seen that not only do you have to make the data freely and openly available, you had to do it in a form that people could consume straight-forwardly. Hence the development of more sophisticated APIs so people could plug in and play. And then in 2012 our bus departure API was launched, and we did a whole bunch of stuff for the Olympics which gave it added impetus.14

TfL now view accurate, real-time travel data as a complement to transport infrastructure in their overriding goal of serving London’s transport users.

Vernon Everitt and Phil Young agree that “the clear policy of [the GLA] helped TfL to prioritise the release of data and achieve it faster than would otherwise have been the case15”. Vernon Everitt observes that “no-one needed to persuade our political masters at the GLA that this was a good idea because their default setting was already openness16”.

Emer Coleman had arrived at the GLA in 2009 on secondment for a year from Barnett council (one of London’s 32 boroughs). Tasked with responding to imminent cuts to public sector funding and a new focus on government transparency, she was seeking a way for London boroughs to collaborate. One of the policies she devised was a proposition around open data that would eventually become the London Datastore. This open data portal would tease out collaboration across London’s boroughs, and respond both to internal pressures to save money and stimulate economic growth in the city, and to external demands coming from open data enthusiasts, and particularly the Guardian newspaper’s Free Our Data campaign (which had been running since 2006), to put public data in public hands.

Ahead of the London Datastore’s release, Coleman issued an open invitation to potential users of the portal in the developer community, with the help of Paul Clarke, a well-known figure in the government open data community who was then working as a contractor at the precursor to gov.uk, DirectGov. The two events that followed attracted between 60 and 100 participants, and calls for data were overwhelmingly focussed on crime and transport. Clarke remembers the collection of people who attended:

It wasn’t just the armchair enthusiast or the casual hacker, or the train enthusiast. There were people there who were very serious about trying to build businesses out of reusing and adding value to public datasets.17

It was becoming clear that any launch of the London Datastore had to have TfL data in there. But Coleman describes a reticence at TfL to release their data openly that persisted “right up to the wire”, as she planned the launch of the portal:

They didn’t want to. […] TfL have come on a tremendous journey. It’s in a very positive place now, so I don’t want to keep harping back to how difficult it was then. But it’s fair to say that there were a number of concerns. They wanted to monetise the data. [And] they had a concern around accountability …. So we did a lot of work explaining to them, well, that’s not really how the economics of this work.18

What appeared as reticence from outside the organisation, was experienced inside TfL as reasonable caution. “You have to remember,” observes Vernon Everitt, “that transport authorities like to control things”. Phil Young tells the story from his perspective:

There was a range of views inside the organisation … and people with those views held them for a reason, there was some logic behind them …. It probably took about a year of discussions, debate, working it through with the GLA, with Emer …. We did get to the place where the argument was over, and the course was set.19

Today, Everitt, Young, and Coleman agree that the economics of developing information services for customers increasingly wanting access via smartphones was a crucial factor in TfL’s decision to release their data. Channels for consuming TfL data were set to diversify quickly, with travellers wanting to access information services on the move:

It was likely the authority was going to spend a lot of public money trying to design apps that wouldn’t meet the consumer demand and the money, the revenue that was generated, would be small. Whereas the knock-on benefit to the travelling commuter [of releasing the data openly] was going to be huge, which would reflect back on TfL. And that’s actually what happened.20

But at the time, TfL was conscious that the decision to go open was in a large part an experimental one. If Everitt had tried to sit down and write a conventional transport business case, he says he would still be writing it:

You couldn’t prove in advance what making the data open was going to lead to. So eventually what we decided was we’d just go for it and see what would happen.

Read More

TfL’s main aim in releasing their data freely was to spur the development of apps in the market. For the policy to be a success, they needed existing or new businesses to develop new products and services based on TfL data, apps that served TfL’s customer base, and responded to transport users’ growing demand to access data about TfL transport services via smartphone.

In 2010, the year after the launch of the special developers’ area of the TfL website, the number of users registered to consume TfL data was in the hundreds. The following year, 2011, it numbered more than a thousand. In 2012, the number had risen to over 4,000 and by 2013 over 5,000 users were registered to consume and transform TfL data21.

TfL are able to put exact figures to how many developers are accessing their data because developers need to register with them in order to access that data. However, beyond this, TfL cannot ascertain directly how many apps are using their data, or how many users these apps are reaching. Examining data download and access statistics could be misleading, because “many developers feed their app estate from their own server architecture and have a single connection to TfL data feeds”22.

Each year, TfL attempts to ascertain take-up of its data indirectly, by counting the apps using the data across the major smartphone platforms. The latest count, done in November 2014, showed 362 smartphone apps using TfL data23.

In a report published in May 2013, Deloitte provided analysis of how many people have downloaded apps powered by TfL data, based on a proprietary research tool provided by xyo.net. They estimated that such apps had been downloaded nearly 4 million times in 2012 (3,979,300)24.

Coleman is keen to convey the speed with which developers take new TfL data releases and transform them into apps, a turnaround which also impresses Vernon Everitt:

When we put the cycle hire docking station data live there were literally two products live in the Apple store 48 hours later.25

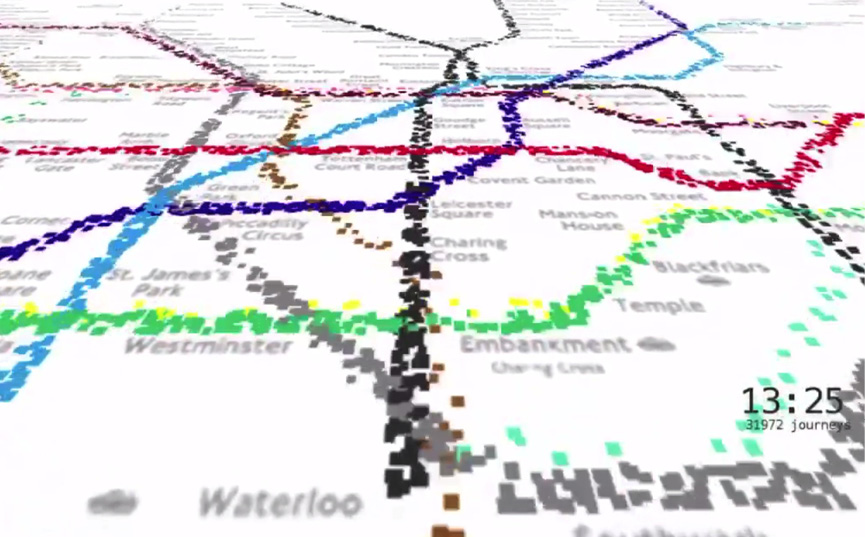
Although this thriving app garden, grown from the seeds of TfL’s data, is the main focus of most research and monitoring in this area, it’s important to note other users of TfL’s data offer, including businesses planning locations of new stores and offices, as well as academics looking into issues such as road safety. Coleman highlights the work of the Centre for Advanced Spatial Analysis at University College London in creating and curating visualisations of TfL data, (see Figure 2 for one example26).

Figure 2: Visualisation of TfL Tube data. Copyright Will Gallia. Reproduced with permission.

Read More

What is the impact of TfL’s open data policy to date? There are multiple lenses through which to view this question. Did TfL save money by adopting a policy that effectively outsourced the majority of its app development? If time is money, how much “money” did TfL save its customers by better informing them of delays and disruptions to transport services? Has general customer satisfaction improved following the policy and what is the value of this to TfL, and to London? Has TfL’s data offer stimulated an app economy that is making a real contribution to London and the nation’s GDP? And has TfL’s leadership in this area influenced other transport players, nationally and internationally, and with what consequence?

It is possible to conclude that TfL have so far saved between £15m-£42m through opening raw data to the app market, rather than developing all its apps in-house. In May 2015, TfL released its own in-house app for users of London’s Santander Cycle Hire Scheme, enabling them to receive a bike release code straight to their phone, without having to use the docking station terminal27 (for more on why TfL developed this app in house, see Discussion, below). A Freedom of Information request submitted to TfL28 reveals development costs of £118,898.06 associated with the new app.

Crudely, we might therefore suggest that had TfL made the decision to hold on to its data and develop all of its apps in-house, it would need to have outlaid development costs of over £43m to deliver all 362 apps currently powered by TfL open data. Alternatively, looking at reach (i.e., app downloads, of which TfL report there had been 29,139 for the cycle app at the time of the FOI response), TfL would need to have spent £16,321,501.77 to achieve the ~4m figure reported by Deloitte. This latter estimate is in a way even more crude given it takes no account of reach over time and in any case bike hire scheme users must make up only a tiny subset of London transport users (and therefore downloaders of London transport apps) overall.

Preparing TfL’s data offer, launching the developer area of the website and generally putting TfL’s data “in a reliable shape29” so that, for example, people could query it on a regular basis, is generally understood internally at TfL to have incurred a one-time cost of about £1m30. The ongoing costs of supplying open data are “almost too hard to disaggregate31” from TfL’s requirements for accurate real-time data both to manage the transport network and to power its own website.

Did the fact that TfL’s open data policy effectively outsourced its app development deliver a cost benefit ratio of 1:43? Or 1:16? “It’s conjecture, really, isn’t it?” says Phil Young:

How much would I spend on building native apps for all of TfL’s transport services? I don’t know how much I would have spent on that. I haven’t costed it, because I didn’t have to do it. But let’s imagine I would have spent a number of millions since 2010. It would be in that order, anyway.32

How has TfL’s open data policy impacted the public it serves? TfL is a public body, so it makes sense that the impact of its open data policy on the public it serves must also be taken into account. The figure most quoted when discussing this aspect of the impact of TfL’s open data policy, is the one derived by Deloitte as part of the Shakespeare Review of Public Sector Information in May 2013. The foundation of this analysis is the idea that time is money:

By making some assumptions about the number of passenger hours saved through better access to information, and the value of an hour, it is possible to estimate the time potentially saved, and the value of that time, owing to the information released by TfL.33

Deloitte used official annual figures on Lost Customer Hours due to transport disruptions, and hypothesised how many users of apps based on TfL data would have avoided the delays by being better informed34. From this analysis, and using official Department for Transport estimates of the value transport users place on their time35, they calculated that overall, apps based on TfL data saved transport users £15m (conservative estimate) or £58m (optimistic estimate) in 2012.

Deloitte compare these annual savings to those projected for users of the first phase of the HS2 rail project linking London and Birmingham, which, if calculated using the same time values as the Deloitte study36, come in at £105 million. This allows Deloitte to imply that by simply making its data open, TfL has delivered monetised time savings that are comparable to those of a major and politically contentious infrastructure investment project.

Using a different approach and set of figures, TfL’s Head of Bus Systems & Technology Simon Reed has shown that apps powered by TfL’s bus data will deliver £83m of customer benefit over 10 years, at a cost to TfL of £820,00037.

Has open data improved TfL’s relationship with its customers? According to Phil Young, TfL measures its relationship with transport users in terms of trust, using metrics including customer satisfaction, user experience, progress and innovation, value for money, and perceptions of how much TfL cares about its transport users:

These metrics add up to a trust metric, and [they’re] all on the way up …. [Open data is] part of the reason or a contributory factor—it’s hard to get the exact delta that you’re getting out of it.38

Although he appreciates it is a crude measure, Vernon Everitt believes it is significant that he no longer receives complaints about TfL’s information provision. Referring to Tube strikes that took place in Spring 2015, he believes that delivering real-time information about disruptions through data feeds “alleviated at least some of the aggravation” caused to London’s commuters:

It’s quite hard get your arms round that and put a number on it. I think if we tried hard enough we probably could. But we just know it’s working.39

He also credits to open data some of TfL’s success in managing London’s transport network when the capital hosted the 2012 Olympic Games. During this time, TfL shared all of its transport planning documents as open data, and although they did not see a significant spike in the creation of new apps, the move “gave employers and government and organisers a sense of confidence that everything we knew, they knew,”40 and helped make the case for everybody involved to work together to deliver a 20% reduction in regular transport demand during peak Games usage.

TfL are in the process of conducting research into what value its data offer has delivered to the London economy through stimulating app development, and expect to have initial findings to report at the end of 2015. Phil Young notes that a lot of small app development companies who started out using TfL’s data have gradually grown into larger tech companies, citing CityMapper and MXData as two examples.

Finally, Vernon Everitt credits recent decisions to embrace open data by other transport organisations, notably National Rail Enquiries, the service run by the Association of Train Operating Companies (ATOC) to provide transport information relating to the UK’s privatised rail network, as following TfL’s lead. It’s important to remember that TfL were only able to demonstrate the benefits of a more open data strategy by taking an initial leap of faith—one the private companies that make up ATOC might have felt less inclined to take by themselves. Now that more open transport data like this is coming online, Everitt anticipates an acceleration in the development of integrated transport apps like CityMapper.

Read More

All interviewees saw no end to TfL’s commitment to open data. Vernon Everitt wishes to expand the program, seeing it as having a key role to play in meeting the challenges of London’s growing population. Emer Coleman described the policy as “embedded” within TfL as an organisation, and said that TransportAPI—the open transport data wholesaler of which she is now a co-director—did not plan for TfL changing their open data policy at a business-risk level.

Paul Clark counsels against assuming that just because one set of data—transport—has immediate and obvious utility, then so will others. The “fascination” with transport data he says he witnessed while helping to organise the GLA developer events ahead of the launch of the London Datastore was “an order or two of magnitude beyond anything else …. Clearly, if you’re going to try and make money out of selling apps then it was transport or nothing”41.

Interestingly, Phil Young points to customer focus group research that indicates that a majority of transport users still want an official TfL travel app, although “whether we’re ready to give it to them, I don’t know”42.

Vernon Everitt was conscious that the release in May 2015 of TfL’s first app developed in-house for some time—the Santander cycle hire app that includes a payment component, mentioned above—had signalled to some that TfL was moving away from open data as a policy:

There is absolutely no question of our commitment to open data in all its forms. What I can’t do is hand over [payment details] to the apps market …. I just think you have to be really careful. You’re talking about people’s bank details here. It’s not for me or for TfL to give away either the individual journey histories or the payment details of our customers. What sane organisation would do that?43

This awareness of the difference between data that is appropriate to release openly and data that contains personal details is undoubtedly a good thing, and apart from the administrative error that saw Customer ID numbers briefly released with cycle hire statistics, TfL appears to get this right. But the interplay of personal data and transport data in the new Santander app does point to an issue also highlighted by Paul Clarke, about the future market for transforming open data, and how it might consolidate as apps exploiting the personal data of their users develop and grow. Although what Clarke terms the “data suck” of apps using open transport data (that is, the amount of data apps extract from their users) is currently quite low, this could change. Just as the rise of Facebook has consolidated audiences and affected the way news publishers function, so once services like Google Now become more adept at anticipating their users’ needs, users may find themselves locked into such services just as many are locked into Facebook today, and data publishers may find the market for their data starkly reduced.

Vernon Everitt also perceives this risk:

I think it’s important that we preserve the ability of apps developers to take this stuff and to make products quickly. If this became just a big corporate enterprise, I think that would work against the principles of openness.44

Opening public data should not equal privatising data, and so far, it has not. Yet we should be conscious of how little we know about the markets created by opening public data. If they turn out to function in any way like the markets created by the rise of the world wide web as a global communications platform, we should be wary of rapid market consolidation.

Read More

For policymakers

  • Transport data is highly amenable to the open data approach, particularly where smartphone adoption among transport users is high. TfL achieved significant cost savings through using an open data approach to outsource app development, and its open data approach has also improved trust.
  • A traditional business case was hard for TfL to model at the outset. This study should encourage policymakers to support transport authorities in making the leap of faith necessary to move to an open data approach.

For the open data community

  • This case should form part of the open data community’s advocacy toolkit. TfL’s move to open its data has been shown to deliver £15m-£58m in annual monetised time savings to London’s transport users, all for relatively low investment. This is comparable to savings used to justify building the first phase of the HS2 rail project linking London and Birmingham—a major transport infrastructure project.

For funders

  • More research is needed into how the market for transport data re-use might consolidate as smartphone users become locked in to personalised services like Google Now. More understanding is needed of the markets created by opening public data. If they turn out to function in any way like the markets created by the rise of the world wide web as a global communications platform, we should be wary of rapid market consolidation.
Read More

Reference

1 BBC News. (2015, February 02). London's population hits 8.6m record high. Retrieved from BBC News: http://www.bbc.co.uk/news/uk-england-london-31082941

2 Transport for London. (n.d.). What we do. Retrieved September 30, 2015, from Transport for London: https://tfl.gov.uk/corporate/about-tfl/what-we-do

3 Transport for London. (n.d.). What we do. Retrieved September 30, 2015, from Transport for London: https://tfl.gov.uk/corporate/about-tfl/what-we-do

4 Interview, Vernon Everitt, Managing Director in charge of Customer Experience, Marketing and Communications, TfL

5 Transport for London. (n.d.). How we are funded. Retrieved September 30, 2015, from Transport for London: https://tfl.gov.uk/corporate/about-tfl/how-we-work/how-we-are-funded?

6 Topham, G. (2014, August 13). Open data and driverless buses: how London transport heads to the future. Retrieved from The Guardian: http://www.theguardian.com/uk-news/2014/aug/13/transport-london-tube-bus-oyster-data

7 Reed, S. (2015). Open Data and Bus Apps. Transport for London Customer Group.

8 Transport for London. (n.d.). Transport Data Service terms and conditions. Retrieved September 30, 2015, from Transport for London: https://tfl.gov.uk/corporate/terms-and-conditions/transport-data-service

9 Interview, Phil Young, Head of Online, TfL

10 Siddle, J. (2014, April 10). I Know Where You Were Last Summer: London’s public bike data is telling everyone where you’ve been. Retrieved from The Variable Tree: http://vartree.blogspot.co.uk/2014/04/i-know-where-you-were-last-summer.html

11 Mirani, L. (2014, April 16). London’s bike-share program unwittingly revealed its cyclists’ movements for the world to see. Retrieved from Quartz: http://qz.com/199209/londons-bike-share-program-unwittingly-revealed-its-cyclists-movements-for-the-world-to-see/

12 Interview, Phil Young, Head of Online, TfL

13 The modern version of this area is available here: https://tfl.gov.uk/info-for/open-data-users/

14 Interview, Vernon Everitt, Managing Director in charge of Customer Experience, Marketing and Communications, TfL

15 Private correspondence, Phil Young and Vernon Everitt

16 Interview, Vernon Everitt, Managing Director in charge of Customer Experience, Marketing and Communications, TfL

17 Interview, Paul Clarke, Independent contractor

18 Interview, Emer Coleman, Director (Business Development), Transport API; Director of Digital Projects, Greater London Authority 2009-2011

19 Interview, Phil Young, Head of Online, TfL

20 Interview, Emer Coleman, Director (Business Development), Transport API; Director of Digital Projects, Greater London Authority 2009-2011

21 Everitt, V. (2014). Delivering better customer information through free open data. PTI, 1, pp. 8-11.

22 Reed, S. (2015). Open Data and Bus Apps. Transport for London Customer Group.

23 Reed, S. (2015). Open Data and Bus Apps. Transport for London Customer Group.

24 Deloitte. (2013, May). Market Assessment of Public Sector Information. Retrieved from Department for Business, Innovation and Skills: https://www.gov.uk/government/uploads/system/uploads/attachment_data/file/198905/bis-13-743-market-assessment-of-public-sector-information.pdf

25 Interview, Vernon Everitt, Managing Director in charge of Customer Experience, Marketing and Communications, TfL

26 For more examples, see (CASA blog network n.d.)

27 Transport for London. (2015, May 11). Revolutionary new Santander Cycles App launched. Retrieved from Transport for London: https://tfl.gov.uk/info-for/media/press-releases/2015/may/revolutionary-new-santander-cycles-app-launched

28 Baxevanis, A. (2015, May 13). FOI request: Santander Cycles app. Retrieved from WhatDoTheyKnow: https://www.whatdotheyknow.com/request/santander_cycles_app

29 Interview, Vernon Everitt, Managing Director in charge of Customer Experience, Marketing and Communications, TfL

30 Both Phil Young and Vernon Everitt used this figure in interview, although neither were able to point to a source confirming it.

31 Interview, Vernon Everitt, Managing Director in charge of Customer Experience, Marketing and Communications, TfL

32 Interview, Phil Young, Head of Online, TfL

33 Deloitte. (2013, May). Market Assessment of Public Sector Information. Retrieved from Department for Business, Innovation and Skills: https://www.gov.uk/government/uploads/system/uploads/attachment_data/file/198905/bis-13-743-market-assessment-of-public-sector-information.pdf

34 Starting from the ~4million “reach” figure quoted further up this report, Deloitte estimated:

20/40% (conservative/optimistic) of people who downloaded an app became regular users

Of these, 10/25% (conservative/optimistic) were able to use the app to find an alternative route in the event of a delay

35 The value of the time saved was calculated according to DfT values of leisure/commuting time, not business time—were it calculated according to the latter figure, the overall value of time saved would be much higher.

36 The original HS2 time savings value (£440m/year in 2012 prices) uses a working time value, not leisure time/commuting time as used in the Deloitte study, so Deloitte have switched the values here. Note that Deloitte are careful to make clear that they have not critiqued the HS2 study as part of their analysis. In this, I have followed their lead.

37 Using TfL’s own survey data, Reed calculates that 24% of daily passenger journeys by bus are supported by apps. Based on passengers’ historic willingness to pay 1.44 pence per journey for SMS services where they can receive information about the time of the next bus and any service delays by typing a code shown on the bus stop into their phone, he calculates a value delivered to bus passengers of £8.3m per year (being the amount of money saved by bus users now they can get the same information for free). This analysis is interesting not least because it puts a figure on the annual running (opex) costs of the Live Bus Arrivals Data feed of £47,000. In addition to the initial development of the data feed (£350,000), this brings the total cost of providing the data over 10 years to £820,000 (against £83m of customer benefit). Reed, S. (2015). Open Data and Bus Apps. Transport for London Customer Group.

38 Interview, Phil Young, Head of Online, TfL

39 Interview, Vernon Everitt, Managing Director in charge of Customer Experience, Marketing and Communications, TfL

40 Interview, Vernon Everitt, Managing Director in charge of Customer Experience, Marketing and Communications, TfL

41 Interview, Paul Clarke, Independent contractor

42 Interview, Phil Young, Head of Online, TfL

43 Interview, Vernon Everitt, Managing Director in charge of Customer Experience, Marketing and Communications, TfL

44 Interview, Vernon Everitt, Managing Director in charge of Customer Experience, Marketing and Communications, TfL

close