Open Data for Developing Economies Case Studies
Nepal Earthquake Recovery
Open Data to Improve Disaster Relief
by Juliet McMurren, Saroj Bista, Andrew Young and Stefaan Verhulst
Problem Focus / Country Context
Nepal is a seismically active country: between 1900 and 2011, there were six serious earthquakes, resulting in a total of around 13,500 deaths.2 In April and May 2015, Nepal was struck by a series of major earthquakes that killed 8,8983 people and injured a further 22,300.4 The first earthquake, measuring magnitude 7.8,5 struck on April 25, 2015, with an epicenter in Barpak Village, approximately 75 km from the capital, Kathmandu. The weeks that followed saw over 300 quakes greater than magnitude 4.0, including a second serious earthquake (magnitude 6.36) on May 12, with an epicenter near Mount Everest.7
The effect of the earthquakes was devastating. Thirty-one of the country’s 75 districts were affected, of which 14 were declared crisis-hit. Almost half a million homes were destroyed,8 including entire villages near the epicenter of the earthquakes,9 and a further 250,000 were damaged.10 In addition, there was extensive damage to government buildings, schools, hospitals, heritage sites, transport and power infrastructure, and agricultural land. All told, almost 3.5 million people were left homeless by the earthquakes, and 8 million people—almost a third of the country’s population—were affected.11
The impact of the earthquakes was exacerbated by Nepal’s poverty and low levels of development. Although Nepal has been highly successful in reducing its poverty rate from 64.7 percent in 2006 to 44.2 percent in 2011, it remains one of Asia’s poorest countries, with a GDP per capita of $2,573 in 2016.12 The United Nations Development Program considers Nepal a low human development country.13
On the 2015 Global Open Data Index, Nepal is ranked 61st of 122 countries, with a score of 30 percent open.14 The 2015 Open Data Barometer ranked Nepal 68th with a score of 13.09, well below the global average of 32.96. As of January 2017, Nepal has not joined the Open Government Partnership (OGP), though preliminary steps have been taken toward that eventual end.15 The 2014 creation of OpenGov Hub Kathmandu, a co-working and collaboration space for open data, transparency and accountability, and civic technology organizations and startups, also points to a continued evolution of open data interest and use in the future.16 However, Nepal’s technical infrastructure and readiness remains limited. According to the ODB, for instance, Nepal has only 15 Internet users per 100 people.17
Text Box: Key Data Providers, Users and Intermediaries
Unlike many of the projects included in this series of case studies, where different actors assumed different roles in the open data value chain, the actors involved in this particular initiative combined roles as data collectors, providers, users and intermediaries. The focus on generating crowdsourced data and putting it to use alongside open government data blurred the lines that typically demarcate traditional roles among open data stakeholders.
With that in mind, the lead actors in the projects examined here are:
Kathmandu Living Labs18 (KLL): A non-profit civic technology company working to create high impact technology to transform the ways government works.
Young Innovations Ltd19: A Kathmandu tech company founded in 2007 specializing in solutions for development, their goal is to establish open data as one of the priorities of the Government of Nepal.
Local Interventions Group20:
Local Interventions Group (LIG) is a non-profit working in the global south to improve governance through data-driven solutions. Founded by participants in a student seminar at the London School of Economics, it has offices in the UK and Nepal. LIG is both data user and provider, having actively sought to expand Nepali open datasets through crowdsourcing and the conversion of static government data to machine-readable format.21
Open Nepal22: a knowledge hub and learning space for Nepali organizations and people who produce, share, and use data for development. The platform is owned by Young Innovations, NGO Federation of Nepal, Freedom Forum, and Development Initiatives, and was intended to bring together journalists, CSOs and those in the tech industry working with open data.23
Code for Nepal24: a 501(c)(3) non-profit organization registered in the U.S., dedicated to empowering Nepal through increasing digital literacy and access to open data, building apps to improve lives, service delivery to earthquake survivors and right to information.25 Cofounded by Mia Mitchell and Ravi Kumar Nepal in 2014, Code for Nepal has pursued projects aimed at bridging the digital divide experienced by women, poor people, rural people, and ethnic minorities in Nepal.26
Key Beneficiaries
Most of the open data projects reviewed here were intended to directly benefit the Nepali population affected by the quakes, either through immediate relief work or through a more efficient and effective recovery. This improved efficiency, however, also benefited aid agencies, donors, and government, through better targeting of relief and recovery efforts and funds. Other projects were intended to reach intermediaries such as journalists, so that they could use the data to improve accountability.
Read MoreThe effort to leverage open data in response to the Nepal earthquakes was diverse, and spanned a number of initiatives and organizations – with additional examples not covered in this case study involving the use of corporate datasets to inform relief efforts.27 This case study focuses on a number of these efforts, addressing each in sequence and then trying to draw some cross-cutting lessons.
(http://www.kathmandulivinglabs.org/projects/national-housing-reconstruction-programme)
Kathmandu Living Labs
Among the most prominent of the projects, Kathmandu Living Labs (KLL), arose out of a collaborative effort in the Fall of 2013. Dr. Nama Raj Budhathoki, now Executive Director of KLL, member of the Humanitarian OpenStreetMap Team (HOT), and local organizer of OpenStreetMap, had recently completed a doctorate in crowdsourcing, open data and social and mobile media at the University of Illinois, Urbana-Champaign in 2010.28 His co-founder, Robert Soden, was working for the World Bank in Washington D.C., and looking for a Nepali partner for a World Bank Open Data for Resilience Initiative (OpenDRI) project in 2012. Robert and Nama met in Kathmandu in Fall 2012, when Nama took on a leadership role on OpenDRI in Nepal. KLL was formed as a not-for-profit civic technology company in the fall of 2013, as a means of continuing the work after the end of the OpenDRI project.29 This kick-off initiative sought to map all the “educational institutions, health facilities, road networks, tangled mesh of gallies, religious sites and other geographic features of Kathmandu Valley.”30
Immediately after the earthquakes, KLL began to build on its pre-earthquake mapping work. Working from desks in the organization’s parking lot—it was unsafe to go back indoors31—KLL members coordinated the work of about 8,000 local and international volunteers who collaborated to build a detailed map of affected areas. Online volunteers around the world used post-quake satellite images to update the team’s pre-quake maps, while in Kathmandu, KLL staff scraped images of damage from social media and mapped the damaged city on foot.32 The resulting map was then used by search and rescue teams, emergency services, the Nepal Army, and international relief agencies such as the Red Cross33 and UN34 to plan and mobilize their resources. The volunteer mapping efforts were coordinated using the Humanitarian OpenStreetMap Team (HOT) tasking manager,35 an open source tool that helps to coordinate large-scale mapping efforts by breaking the job into smaller tasks to be assigned to collaborators.36
KLL also used its data to develop QuakeMap.org, a website through which users could report their needs to emergency organizations. With phone networks largely inoperative after the earthquakes, the internet became a lifeline for many. Built on the open source Ushahidi platform that had previously been used after the Haiti and New Zealand earthquakes, QuakeMap.org invited people to contribute information in real time about immediate local needs. Observers could note where people were trapped, identify damage to infrastructure, post information on resources such as emergency shelter, or ask for assistance with necessities such as shelter, food, and water.37 KLL had a small team of volunteers dedicated to validation of reports on QuakeMap.org, via a callback to the poster to verify the facts. The Nepal Army, which took the lead in the relief effort, downloaded reports from QuakeMap.org every two hours, passing on requests for assistance to their relief division. A second level of validation also took place within Army headquarters, where a desk was set up to verify QuakeMap.org reports.38 Once assistance was received, the database was updated to indicate the problem was resolved and to avoid duplication of resources.39 QuakeMap.org also included a page called Who’s Doing What Where, to help relief agencies view activity in the field and direct their work more effectively.
Open Nepal and Young Innovations
A second prominent initiative, the Earthquake Response Transparency Portal,40 was launched by Open Nepal and Young Innovations, two organizations involved in technology and development. Soon after the Haiti earthquake in 2010, more than 40 countries ratified the International Aid Transparency Initiative (IATI)41 standard for publishing development-related data (including budgets, annual reports, and strategic documents for country plans). In 2012, Young Innovations launched AidStream,42 a platform to help aid organizations publish data in the IATI format, which uses XML.43 Since then, the format has been adopted by more than 470 organizations, including Oxfam, the Red Cross, and the Bill & Melinda Gates Foundation.44
Before the earthquakes, few organizations within Nepal had adopted the standard.45 However, within 24 hours of the first earthquake, Open Nepal, an online and offline development data knowledge hub, and Young Innovations had partnered to produce the Earthquake Response Transparency Portal, a portal that tracks national and international donations (both cash and in-kind) to earthquake relief efforts. As Bibhusan Bista, CEO Young Innovations, put it:
Immediately after the earthquake there was a self-ignited, organic movement among youth in different sectors… to provide whatever assistance they could to earthquake victims. On April 26, the day after the earthquake, five or six of my colleagues and I gathered in the carpark at our office, since the ground was still shaking and we couldn’t go inside. And we asked ourselves: what can we do? Instead of rushing to the field, where a lot of people are already active, can we do something based on our expertise? So… we said, let’s start tracking the resources coming into Nepal.46
The group began with United Nations Office for the Coordination of Humanitarian Affairs (OCHA) Financial Tracking Service (FTS) data, but then began scraping, cleaning and standardizing data as it was reported in the national and international media, as well as from government and non-government sources, to create a centralized portal. As Bista said: “There were a lot of questions being asked: do we have enough resources? Are those resources being used appropriately? We needed a common, accessible repository to track those data.”47
The portal’s intent was “to support the accountable and effective use of funds that are available for relief and reconstruction activities.” To achieve this goal, it sought to 1) establish the traceability of funds from donors to intermediaries to implementing organizations; 2) enable inquiries about results of specific relief efforts and projects; and 3) provide a country-wide view of relief efforts to avoid duplication. Attempting to provide a holistic view of relief efforts and their finances, the portal shows both data from primary and secondary sources on funds given and received by all national and international entities, as well as how funds were used by these organizations.48 Data used to build the portal is available for download in.csv format.
The data used for the Earthquake Response Transparency Portal had to be scraped, cleaned and standardized before it could be used. Much of the data came from press releases issued by donors and was in unstructured text format, which had either to be manually entered or scraped using purpose-built tools. Data from the UN was machine-readable, but not fully open. Double counting was common in the days after the earthquake, with numbers reported from donors and implementing agencies working on the same project being added together.49
Bista observes that the portal was intended to reduce friction and overcome some of the delays inherent in IATI reporting. In addition, the portal was also designed to address irregularities that often plague the aid and donor ecosystem. Bista notes that irregularities are apparent just by looking at the data at the macro level. For example, he said that despite a promised 4.4 billion USD in aid, the data only accounted for some 3.85 billion USD.50 The Earthquake Response Transparency Portal sought to address such shortcomings by tracking pledge money as it passed from the donors through intermediaries, and by independently verifying aid money’s use for intended projects in an open manner. In the process, Young Innovations hopes to improve accountability by uncovering instances of corruption or inefficiencies leading to money failing to reach its intended beneficiaries. “Independently verifying that the pledged money was delivered to the intended project is the biggest challenge for transparency and accountability today,” he says. “We want to prevent the Haiti mistakes and serve as a model for how technology can help facilitate transparency and accountability.”51
The main users of the Earthquake Response Transparency Portal were data-using intermediaries such as journalists. After the post-disaster needs assessment and the donors’ conference, as donor pledges began to flow in, media reporting often failed to make a distinction between pledges, commitments and actual disbursement. As Bista put it: “There were reports in the media saying, this is the amount that has been given by India, or the UN. We wanted to educate intermediaries that we have actually not received that money. The pledge has to be converted to commitment, the commitment then has to be converted to disbursement, the disbursement then has to be converted to expenditure on an actual project.”52
In addition to data intermediaries, Bista identifies three other potential target audiences: the donors themselves, to hold them accountable for gaps between pledges and actual disbursement; CSOs and NGOs, who could use the portal both to investigate donor resources and areas of interest for potential rebuilding projects, and to “follow the money” to ensure projects were carried out; and government policymakers, to enable planning of government contributions to the rebuilding.53
Code for Nepal
A third series of projects were launched by Code for Nepal, a Nepal-based nonprofit that seeks to leverage innovation, data and training efforts to improve public life. Soon after the first earthquake, Code for Nepal was looking for ways to provide a humanitarian response in badly affected regions outside Kathmandu. To do this, the team used a low-tech form of crowdsourcing, hoping to encourage the widest possible participation.54 Within 36 hours of the earthquake, Code for Nepal developed an open Google document to enlist information about relief agencies, volunteers and victims.55
Additionally, Code for Nepal carried out two surveys of earthquake survivors to seek feedback on the kind of aid they had received. Rahat Payo56 (a Nepali term meaning “did you get relief?”) and the Kobo Toolbox57 surveys were carried out in two phases. The first phase surveyed 776 affected Nepalis in 40 locations across five districts in August 2015. A second phase, conducted in December 2015, focused solely on residents of the village of Barpark, the epicenter of the first major earthquake. The preliminary findings were published on the Code for Nepal website and the data shared in an open format.58 The results of the surveys were published in the media, and were shared with non-profits working in the field, providing a granular, on-the-ground perspective of the effectiveness and reach of aid distribution. Ravi Kumar reports that more surveys are planned, probably in online format.59
Local Interventions Group
Local Interventions Group, a governance-focused non-profit with offices in Nepal, also used open data to address the post-earthquake situation. This work was built on the foundations and experience of earlier projects in the areas of open governance, crowdsourcing, and smarter city solutions. In particular, the organization had built projects to help Kathmandu citizens report complaints concerning local police; crowdsourced grievances with government in two remote regions of Nepal; and worked with Google to create GIS maps of human trafficking hotspots and routes.
Within 24 hours of the earthquake, Local Interventions Group began partnering with the Nepali Home Ministry to digitize information collected by its post-earthquake emergency telephone hotline. It partnered with Accountability Lab, an incubator aimed at “strengthening systems of accountability,”60 to send out Mobile Citizen Help Desks into affected areas, identify local needs and link affected communities to resources. Over subsequent weeks and months, as the recovery progressed, this work developed into #quakeHELPDESK, a four-part earthquake response strategy that not only allowed users to track aid data use, but also provided “a platform for affected communities, emergency responders, and volunteers to report gaps at the last mile.”61
The other components of the project included citizen perception surveys conducted for the UNOCHA InterAgency Common Feedback Project62 (an open data platform designed to improve the responsiveness of the relief and recovery effort); the Open Mic Project,63 a partnership with Internews which sought to track and counter earthquake rumors and misinformation; and Follow the Money, an aid tracking and accountability program.64 All these projects helped the Local Interventions Group close the feedback loop through a communications campaign with the UN, in which town hall meetings with local political representatives to discuss grievances raised through the #quakeHELPDESK were broadcast on local FM radio.65
Who’s Doing What Where
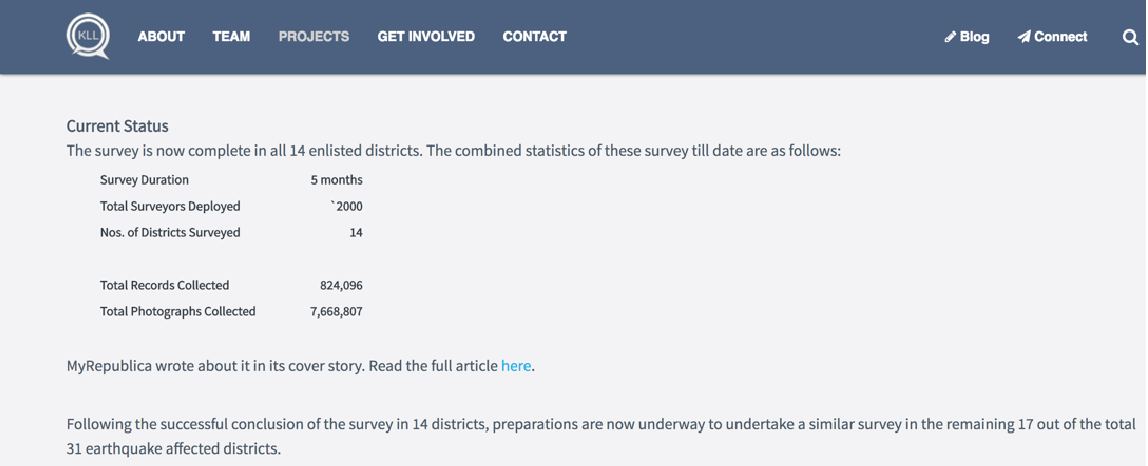
In addition to these projects, various other organizations also sought to use data to introduce new efficiencies and greater transparency into relief efforts. One notable example arose from the Humanitarian Data Exchange (HDX),66 an open platform managed by the UN OCHA for sharing humanitarian data to drive analysis. The HDX team set up Nepal—Who’s Doing What Where (Housing Recovery and Reconstruction) (HRRP 4W). This tool inventories relief housing efforts in the 14 districts most severely affected by the earthquakes according to what, where, when, and by whom projects are being planned and carried out. Data is supplied every two weeks through self-reporting after training by over 350 partner organizations working in housing recovery and reconstruction. The data are then compiled and cleaned at a national level, and used to develop reports.67 The current database shows data from January 1, 2016 to the present, and reports continue to be filed as of late August 2016.
Funding
The projects had varied sources (and amounts) of funding. The Earthquake Response Transparency Portal was funded entirely by Young Innovations from the proceeds of its more commercial activities.68 Most of the projects, however, were heavily dependent on grants from aid agencies such as the United Nations. Quake Map and the perceptions surveys that formed part of #quakeHELPDESK were both UN funded, for example.69 The work of Code for Nepal was funded largely through donations, although the second Rahat Payo survey was supported by George Mason University and Tufts University.70
Read MoreReference
1 . Special thanks to Akash Kapur who provided crucial editorial support for this case study, and to the peer reviewers who provided input on a pre-published draft.
2 . Wikipedia, “List of Earthquakes in Nepal,” Wikipedia.org, https://en.wikipedia.org/wiki/List_of_earthquakes_in_Nepal.
3 . Government of Nepal, Nepal Earthquake 2015: Sector plans and financial projections, May 2016, http://nra.gov.np/uploads/docs/AStGGdnejZ160823113341.pdf.
4 . National Planning Commission of Nepal, Post Disaster Need Assessment, Executive Summary, NPC, 2015.
5 . Jessica Robertson and Heidi Koontz, “Magnitude 7.8 Earthquake in Nepal and Aftershocks,” U.S.G.S., May 12, 2015, https://www2.usgs.gov/blogs/features/usgs_top_story/magnitude-7-8-earthquake-in-nepal/; and Government of Nepal, Nepal Earthquake 2015: Sector plans and financial projections, May 2016, p. 47, http://nra.gov.np/uploads/docs/AStGGdnejZ160823113341.pdf.
6 . Jessica Robertson and Heidi Koontz, “Magnitude 7.8 Earthquake in Nepal and Aftershocks,” U.S.G.S., May 12, 2015, https://www2.usgs.gov/blogs/features/usgs_top_story/magnitude-7-8-earthquake-in-nepal/.
7 . “Nepal – Earthquake post disaster needs assessment: sector reports (English),” The World Bank, 2015, http://documents.worldbank.org/curated/en/546211467998818313/Nepal-Earthquake-post-disaster-needs-assessment-sector-reports.
8 . Ibid.
9 . Sahina Shrestha, “Lang Tang Is Gone,” Nepali Times, May 1-7,2015, http://nepalitimes.com/article/nation/langtang-destroyed-in-earthquake,2205.
10 . https://www.worldbank.org/content/dam/Worldbank/document/SAR/nepal/PDNA%20Volume%20A%20Final.pdf
11 . Ibid.
12 . International Monetary Fund, “Report for Selected Countries and Subjects,” IMF, October 2015, http://www.imf.org/external/pubs/ft/weo/2015/02/weodata/weorept.aspx?sy=2015&ey=2016&scsm=1&ssd=1&sort=subject&ds=.&br=1&pr1.x=34&pr1.y=16&c=558&s=NGDPD%2CNGDPDPC%2CPPPGDP%2CPPPPC&grp=0&a=.
13 . United Nations Development Program, Human Development Report 2015, “Statistical Annex,” UNDP, http://hdr.undp.org/sites/default/files/hdr_2015_statistical_annex.pdf
14 . Open Knowledge, “Global Open Data Index: Nepal,” http://index.okfn.org/place/nepal/.
15 . Narayan Adhikari and Pranav Budhathoki, “The OGP Process in Nepal – On the Path of Our Own Choosing,” Open Government Partnership Blog, December 1, 2016, http://www.opengovpartnership.org/blog/narayan-adhikari/2016/12/01/ogp-process-nepal-%E2%80%93-path-our-own-choosing.
16 . “We’ve Opened an OpenGov Hub in Nepal!” OpenGov Hub, May 21, 2014, http://opengovhub.org/blog/5/2014/weve-opened-an-opengov-hub-in-nepal.
17 . World Wide Web Foundation, “Open Data Barometer, 2015,” http://opendatabarometer.org/data-explorer/?_year=2015&indicator=ODB&lang=en&open=NPL.
18 . http://www.kathmandulivinglabs.org/
19 . http://younginnovations.com.np/
20 . http://www.localinterventions.org.uk/
21 . Interview with Pranav Budhathoki, CEO, Local Interventions Group, September 7, 2016.
22 . http://opennepal.net/
23 . Interview with Bibhusan Bista, CEO, Young Innovations, September 12, 2016..
24 . http://codefornepal.org/en/
25 See: Code for Nepal, http://codefornepal.org/en/.
26 Code for Nepal, “About Us,” http://codefornepal.org/en/about-us/.
27 Stefaan G. Verhulst, “Corporate Social Responsibility for a Data Age,” Stanford Social Innovation Review, February 15, 2017, https://ssir.org/articles/entry/corporate_social_responsibility_for_a_data_age.
28 . Saira Asher, “How ‘Crisis Mapping’ Is Helping Relief Efforts in Nepal,” BBC News, May 6, 2015, http://www.bbc.com/news/world-asia-32603870.
29 . See: Kathmandu Living Labs, http://www.kathmandulivinglabs.org/pages.
30 . “Who We Are,” Kathmandu Living Labs, http://www.kathmandulivinglabs.org/about.
31 . Shreeya Sinha, “Three Ways Nepalis Are Using Crowdsourcing to Aid in Quake Relief, New York Times, May 1, 2015, http://www.nytimes.com/2015/05/02/world/asia/3-ways-nepalis-are-using-crowdsourcing-to-aid-in-quake-relief.html?_r=3.
32 . Imogen Wall, “Could Mapping Tech Revolutionize Disaster Response? The Guardian, April 25, 2016, https://www.theguardian.com/global-development-professionals-network/2016/apr/25/could-mapping-tech-revolutionise-disaster-response?CMP=share_btn_tw.
33 . Shreeya Sinha, “Three Ways Nepalis Are Using Crowdsourcing to Aid in Quake Relief, New York Times, May 1, 2015, http://www.nytimes.com/2015/05/02/world/asia/3-ways-nepalis-are-using-crowdsourcing-to-aid-in-quake-relief.html?_r=3.
34 . Imogen Wall, “Could Mapping Tech Revolutionize Disaster Response? The Guardian, April 25, 2016, https://www.theguardian.com/global-development-professionals-network/2016/apr/25/could-mapping-tech-revolutionise-disaster-response?CMP=share_btn_tw.
35 . http://tasks.hotosm.org/
36 . Nirab Pudasaini, “Open Source and Open Data’s Role in Nepal Earthquake Relief,” OpenSource.com, June 8, 2016, https://opensource.com/life/16/6/open-source-open-data-nepal-earthquake
37 . Saira Asher, “How ‘Crisis Mapping’ Is Helping Relief Efforts in Nepal,” BBC News, May 6, 2015, http://www.bbc.com/news/world-asia-32603870
38 . Interview with Dr Nama Raj Budhathoki, Executive Director, Kathmandu Living Labs, September 10, 2016.
39 . Siobhan Heanue, “Nepal Earthquake: How open data and social media helped the Nepalese to help themselves,,” ABC News, August 17, 2015, http://www.abc.net.au/news/2015-08-16/nepal-earthquake-how-open-data-social-media-helped-rebuild/6700410.
40 . http://earthquake.opennepal.net/
41 . http://www.aidtransparency.net/
42 . http://aidstream.org/
43 . Jennifer Rigby, “A Year After the Devastating Earthquake, Nepals Young Are Rebuilding Their Country,” Quartz.com, April 27, 2016, http://qz.com/670197/a-year-after-the-devastating-earthquake-nepals-young-are-rebuilding-their-country/
44 . “Who’s Using It?” AidStream, https://aidstream.org/who-is-using
45 . Amrit Sharma, “Where Is All the Aid Money for Nepal Going? Open data could help lift the veil,” Takepart.com, August 6, 2015, http://www.takepart.com/article/2015/08/06/open-nepal-earthquake-aid-money
46 . Interview with Bibhusan Bista, CEO, Young Innovations, September 12, 2016.
47 . Ibid.
48 . Young Innovations, “Earthquake Response Transparency Portal,” http://earthquake.opennepal.net/about.
49 . Interview with Bibhusan Bista, CEO, Young Innovations, September 12, 2016.
50 . Amrit Sharma, “Where Is All the Aid Money for Nepal Going? Open data could help lift the veil,” Takepart.com, August 6, 2015, http://www.takepart.com/article/2015/08/06/open-nepal-earthquake-aid-money.
51 . Ibid.
52 . Interview with Bibhusan Bista, CEO, Young Innovations, September 12, 2016.
53 . Ibid.
54 . Femke Mulder, et al., “Questioning Big Data: Crowdsourcing crisis data towards and inclusive humanitarian response,” Big Data and Society, August 1, 2016, http://bds.sagepub.com/content/3/2/2053951716662054.
55 . Interview with Ravi Kumar Nepal, September 9, 2016.
56 . http://codefornepal.s3.amazonaws.com/rahatpayo/index.html
57 . https://1s3ej.enketo.kobotoolbox.org/webform
58 . Interview with Ravi Kumar Nepal, September 9, 2016.
59 . Ibid.
60 . http://www.accountabilitylab.org/
61 “Our Mission,” #quakeHELPDESK, http://www.quakehelpdesk.org/what.php
62 . http://cfp.org.np/
63 . http://www.quakehelpdesk.org/openmic.php
64 . Local Interventions Group, “Interagency Common Feedback Project: Nepal earthquake 2015,” http://www.localinterventions.org.uk/programmes.php?post=32.
65 . Interview with Pranav Budhathoki, CEO, Local Interventions Group, September 7, 2016.
66 https://data.humdata.org/
67 . Humanitarian Data Exchange, “Nepal—Who’s Doing What Where,” https://data.humdata.org/dataset/160625-hrrp-4w-national.
68 . Interview with Bibhusan Bista, CEO, Young Innovations, September 12, 2016.
69 . Interview with Pranav Budhathoki, CEO, Local Interventions Group, September 7, 2016.
70 . Interview with Ravi Kumar Nepal, September 9, 2016.
71 . See: Kathmandu Living Labs, http://www.kathmandulivinglabs.org/pages.
72 . Shreeya Sinha, “Three Ways Nepalis Are Using Crowdsourcing to Aid in Quake Relief, New York Times, May 1, 2015, http://www.nytimes.com/2015/05/02/world/asia/3-ways-nepalis-are-using-crowdsourcing-to-aid-in-quake-relief.html?_r=3.
73 .Ibid.
74 Ibid.
75 . Nirab Pudasaini, “Open Source and Open Data’s Role in Nepal Earthquake Relief,” OpenSource.com, June 8, 2016, https://opensource.com/life/16/6/open-source-open-data-nepal-earthquake.
76 .Interview with Dr. Nama Raj Budhathoki, Executive Director, Kathmandu Living Labs, September 10, 2016.
77 . Interview with Bibhusan Bista, CEO, Young Innovations, September 12, 2016..
78 . Ibid.
79 . Amrit Sharma, “Where Is All the Aid Money for Nepal Going? Open data could help lift the veil,” Takepart.com, August 6, 2015, http://www.takepart.com/article/2015/08/06/open-nepal-earthquake-aid-money.
80 . Shreeya Sinha, “Three Ways Nepalis Are Using Crowdsourcing to Aid in Quake Relief, New York Times, May 1, 2015, http://www.nytimes.com/2015/05/02/world/asia/3-ways-nepalis-are-using-crowdsourcing-to-aid-in-quake-relief.html?_r=3.
81 . Saira Asher, “How ‘Crisis Mapping’ Is Helping Relief Efforts in Nepal,” BBC News, May 6, 2015, http://www.bbc.com/news/world-asia-32603870.
82 . Interview with Dr. Nama Raj Budhathoki, Executive Director, Kathmandu Living Labs, September 10, 2016.
83 . Saira Asher, “How ‘Crisis Mapping’ Is Helping Relief Efforts in Nepal,” BBC News, May 6, 2015, http://www.bbc.com/news/world-asia-32603870.
84 . Amrit Sharma, “Where Is All the Aid Money for Nepal Going? Open data could help lift the veil,” Takepart.com, August 6, 2015, http://www.takepart.com/article/2015/08/06/open-nepal-earthquake-aid-money.
85 . Interview with Bibhusan Bista, CEO, Young Innovations, September 12, 2016.
86 . Ibid.
87 . Interview with Pranav Budhathoki, CEO, Local Interventions Group, September 7, 2016.
88 . Ibid.
89 . Interview with Pranav Budhathoki, CEO, Local Interventions Group, September 7, 2016.
90 . Ibid.
91 . Interview with Dr Nama Raj Budhathoki, Executive Director, Kathmandu Living Labs, September 10, 2016.
92 . Ibid.
93 . Ibid.
94 . GovLab interview with Adele Waugaman, September 16, 2016.
95 . Shreeya Sinha, “Three Ways Nepalis Are Using Crowdsourcing to Aid in Quake Relief, New York Times, May 1, 2015, http://www.nytimes.com/2015/05/02/world/asia/3-ways-nepalis-are-using-crowdsourcing-to-aid-in-quake-relief.html?_r=3.
96 . Interview with Dr Nama Raj Budhathoki, Executive Director, Kathmandu Living Labs, September 10, 2016.
97 . Ibid.
98 . Interview with Ravi Kumar Nepal, September 9, 2016.
99 . Ibid.
100 . Interview with Bibhusan Bista, CEO, Young Innovations, September 12, 2016.
101 . Interview with Ravi Kumar Nepal, September 9, 2016.
102 . Interview with Dr Nama Raj Budhathoki, Executive Director, Kathmandu Living Labs, September 10, 2016.
103 . Interview with Bibhusan Bista, CEO, Young Innovations, September 12, 2016.
104 . Ibid.
105 . Ibid.