Open Data for Developing Economies Case Studies

Tanzania’s Open Education Dashboards

Improving Education with Open Data

by Juliet McMurren, Andrew Young and Stefaan Verhulst

Impactcitizens

Sectoreducation

LocationTanzania

Read Time

Brief View 6 MINS

Full Story 18 MINS

Low national examination pass rates in 2012 caused a public outcry in Tanzania, but the public’s understanding of the broader context and ability to demand accountability was limited by a lack of information about the country’s education sector. Two portals tried to remedy that situation, providing the public with more data on examination pass rates and other information related to school quality. The first, the Education Open Data Dashboard (educationdashboard.org), was a project established by the Tanzania Open Data Initiative, a government program supported by the World Bank and the United Kingdom Department for International Development (DFID) to support open data publication, accessibility and use. The second, Shule (shule.info), was spearheaded by Arnold Minde, a programmer, entrepreneur, and open data enthusiast who has developed a number of technologies and businesses to catalyze social change in Tanzania. Although both portals show considerable promise – especially as it relates to visualization open data to make it more comprehensible to a wide audience –they have, to date, had limited success in actually changing citizen decision-making about education or generating greater institutional accountability. This is due in part to the challenges posed by Tanzania’s low Internet penetration rates and unfamiliarity with open data.

Read More

Problem Focus / Country Context

In 2012, education in Tanzania became the subject of significant public discontent and controversy. That year, six out of every ten Tanzanian students failed the standardized national secondary-level examination, resulting in a media outcry and demand for reforms.4 The poor results were the product of recent changes to the Tanzanian education system, in which tuition fees for government primary schools were eliminated in an effort to raise the country’s school enrollment and literacy rates. The move triggered a rapid increase in net primary enrollment, from 66 percent in 2001 to 90 percent in 2004.5 This increase, however, was not matched by a proportional increase in school funding.

As the Tanzanian school system strained under the burden of the additional enrollments, examination pass rates among the 30 percent of secondary-aged children enrolled in school6 began to decline. After the particularly bad set of results in 2012, the government introduced changes to the grading system7 that appeared to raise the pass rate in 2013 and 2014.8 However, the root causes of the nation’s education problems remained unaddressed: inadequately funded and supplied schools, a shortage of trained teachers,9 limited teacher training and professional development, discontent regarding teachers’ pay,10 and stubborn regional, economic, and social inequalities.

At the same time, information about public education was not easy to come by, making it hard for citizens to understand the true state of the education sector and demand accountability from government officials. Although several Access to Information bills have gone before the Tanzanian Parliament, none has yet been enacted, while other legislation, including the country’s defamation law, constrains the media’s capacity to function critically and independently. The Tanzanian media is considered only partly free by Freedom House,11 and the country was ranked 75th out of 180 countries in the 2015 World Press Freedom Index.12

In addition, there is a noticeable lack of independent voices in the Tanzanian media. While media ownership is transparent, it remains concentrated among a few proprietors. All four radio stations with national reach are regarded as favoring the ruling party, although the African Media Barometer did report in 2010 that the state-run Radio Tanzania had demonstrated more balanced views. Media outlets favorable to the opposition reportedly have government advertising contracts withheld.13 Consequently, when stories about the state of education do make it to press, they tend to favor the official version of events, and often lack balance or context.

Citizens were for the most part unable to turn to the Internet or open data as substitutes for the information they needed. Open data use in Tanzania remains in its infancy. The Open Data Barometer places Tanzania in the “capacity constrained” cluster of countries whose open data initiatives are challenged by limits in government, civil society or private sector capacity, Internet penetration, and data collection and management.14 Tanzania joined the Open Government Partnership Initiative in September 2011. The second phase of its OGP action plan, currently under development, commits the government to establishing an open data portal (opendata.go.tz) that would release key datasets in the education, health, and water sectors in machine-readable form.15 As of October 2016, the portal has 100 datasets available for download, 65 of which are supplied by the Ministry of Education.

Key Data Providers

Education Open Data Dashboard (educationdashboard.org): Data was supplied by the National Examinations Council of Tanzania (NECTA), with additional resources from the World Bank integrated to improve the comprehensiveness of datasets.

Shule.info: Shule.info was built on similar data sources, but they were often manually scraped and collected by project organizers.

Key Data Users and Intermediaries

Education Open Data Dashboard: The project was developed as part of the Tanzania Open Data Initiative, a government program supported by the World Bank and the United Kingdom Department for International Development (DFID).

Shule.info: Shule.info was developed by Arnold Minde, a Tanzanian programmer, with some practical support and assistance from Twaweza.

Key Beneficiaries

Both portals aimed to improve parents’ decision-making regarding their children’s schools. In addition, they sought to improve journalism, especially regarding education-related issues, and to inform public debate regarding education.

Read More

Initiation of the open data activity

In 2013, the National Examinations Council of Tanzania (NECTA), a government body, rolled out a pilot education dashboard16 offering data downloads, searches, and visualizations of primary and secondary examination results by district and school. The dashboard also included statistics on pupil-teacher ratios, annual and average pass rates, national rankings of school performance, and changes in pass rates since 2011. With the help of the World Bank, an updated version of the pilot was launched in 2015 as Education Open Data Dashboard (educationdashboard.org).17 Despite some challenges and gaps described in more detail below, the data contained on the site represents a significant advance in the context of Tanzania’s previous information drought.

tanzania-0.png

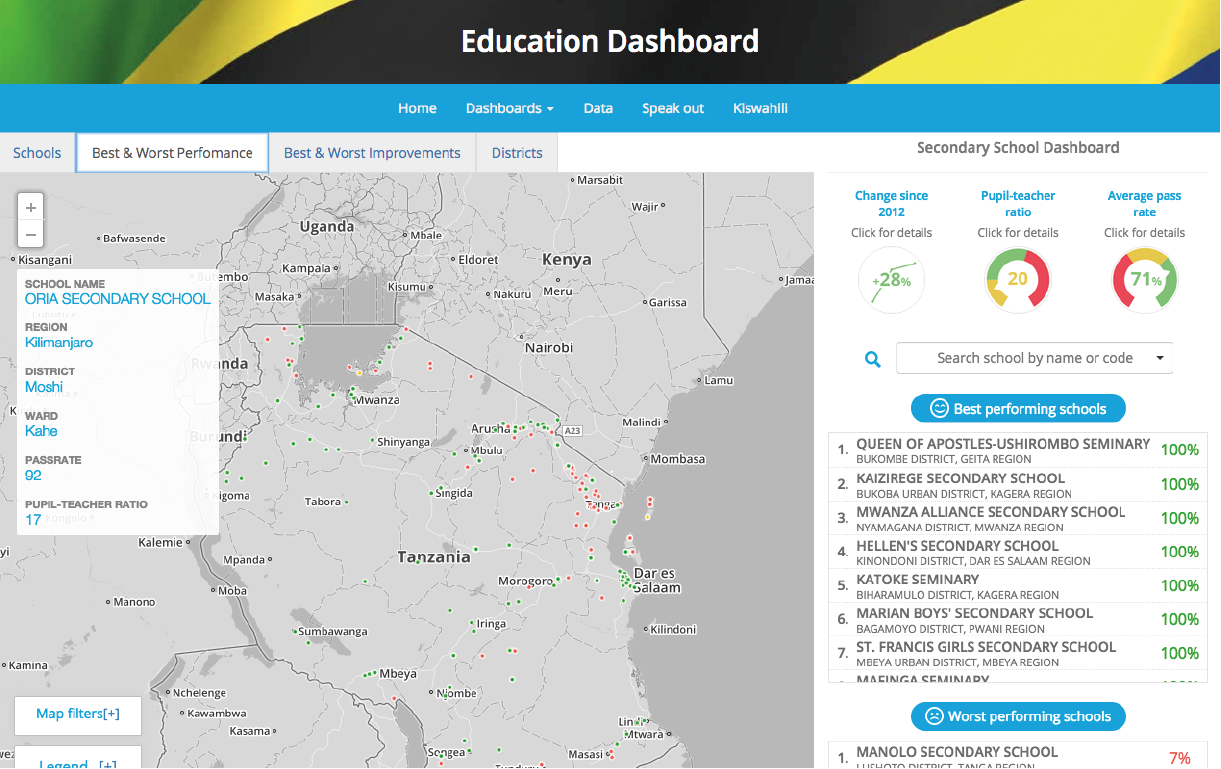
Figure 1: Mapping of school performance on the educationdashboard.org

Shule.info was the brainchild of the Tanzanian programmer Arnold Minde. It was released shortly after NECTA’s original dashboard, and was conceived when Minde became aware that NECTA had been publishing individual exam results online since 2004. It wasn’t until 2012, however, when poor examination pass rates prompted nationwide soul-searching, that Minde began working on the project in earnest. At that point, he realized the potential value of a single, readily usable, online source of national examination data.18 Such data needed to be online and presented in a comprehensible format, he concluded, so that citizens could see that the poor results in 2012 were not a new phenomenon, but part of a downward trend over the past six to seven years. Minde had previously been involved in data visualization through his work for the Tanzanian development policy think tank REPOA (formerly Research on Poverty Alleviation); that work convinced him of the power of data visualization to communicate data trends and linkages, and helped shape the development of Shule.19

tanzania-1.png

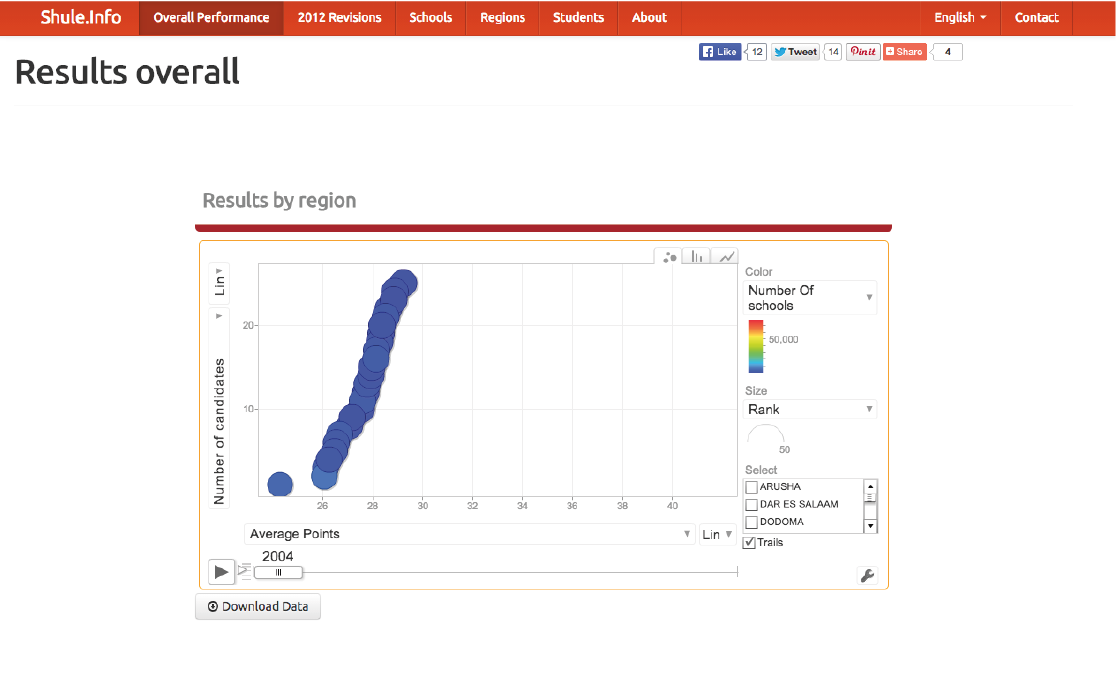
Figure 2: Education results by region on Shule.info

Demand and supply of data type(s) and sources

Both sites made the data on which they were built open for download by users. In addition, charts and visualizations were available directly on the platforms.

Although the data used to create Shule.info was available in isolated reports and websites, intended for individual students, it had never been made fully open in searchable and machine-readable format for citizens at large. Minde scraped, cleaned, and consolidated the data from the examination results as they were released each year.20

Education Open Data Dashboard used the government’s own data, much of which is available through the official government open data portal. While there is much useful data available, some gaps do exist, including a dearth of individual examination results, pass rates before 2012, average pass rates over time, and pass rates by gender and region.

Funding

Shule.info was created on Minde’s own time and at his expense. Education Open Data Dashboard was funded by the Tanzanian government, with some support from the World Bank.

Open data use

Both dashboards rely on government data. The data used to create Shule.info were publicly available but not open, requiring scraping, cleaning and standardization. The data on Education Open Data Dashboard were fully open, having been released on the Tanzanian government’s open data portal.

Shule.info presents data for Form 4 examination results from 2004 to 2013 at candidate, school, regional and national levels. It also offers data visualizations of results (broken up by region and gender), which permits users, for example, to track average performance over time, the number of candidates in each grading division over time, and the impact of the government’s controversial revision of the 2012 results. All data used to build the site is available for download. Shule therefore offers considerably more, and more granular, data than Education Open Data Dashboard. In addition (and in contrast to NECTA’s dashboard), Shule offers commentary on its data visualizations, making it easier for users to understand the significance of the data they are accessing.

Read More

Tanzania is a country with low Internet penetration rates (5.3 percent in 2016, according to ITU, the United Nations specialized agency for information and communication technologies),21 and is marked by a general lack of technical skills and expertise among the population. As noted, there is very little familiarity with the concept and potential of open data, or data in general. As such, although these projects represent notable advances within the current open data ecology, uptake and usage have generally been limited, making it hard to assess impact.

Nonetheless, a few metrics can be considered to measure the effects—limited though they are–of Shule and Education Open Data Dashboard. Impact can be gauged in three broad ways: engagement and use by both citizens and intermediaries; data quality and diversity; and spillover effects on other open data projects.

Engagement and use

After Shule went live in June 2013, the site averaged around 1,500 visits per month, according to Arnold Minde.22 Feedback directly on the site and through Twaweza suggests that visitors fell into two categories. The first consists of data sophisticates, typically programmers or employees of civil society organizations, who were already aware of the potential of open data to inform decision-making, and visited the site to research education in Tanzania and better understand the overall educational context. These visitors may have become aware of the site through Twaweza and its civil society partners, or the emerging open data community in Dar-es-Salaam.

The second category of site visitors consisted of former students making use of the site’s archive of examination results to look up their scores.23 These students may not initially have been interested in or even aware of open data, but they are nonetheless exposed to Shule’s visualizations on, for example, school performance by region, and other tools when they access the site. Engaging the ordinary Tanzanian families Minde had originally hoped to reach has been more challenging. Low rates of Internet penetration and a lack of experience using the Internet have restricted the amount of casual traffic received through search engines.

Minde says he fears that average Tanzanians don’t have much interest yet in looking at data visualizations, preferring to get their information predigested by the media. “I don’t see people asking the real questions,” says Minde. “I don’t see discussions around the issues, even among people I know.”24 Aidan Eyakuze, Executive Director of Twaweza, believes both the public and policymakers are looking for the insight contained in the data, not the data itself. “Data is frightening for many people, so raw data is going to appeal to a vanishing few,” he says. “Open data needs to be open plus curated plus chewed plus digested to appeal to most people, including policymakers.”25 Few in the media, however, have the knowledge and skills to digest Shule’s data offerings, despite initiatives like the Data Bootcamp, which was designed to introduce members of the Tanzanian media to open data.26

Education Open Data Dashboard’s use was similarly constrained by Tanzania’s low rate of Internet use. Nonetheless, the site’s developers point out that Tanzanians don’t necessarily need Internet access to benefit from the information stored on the site. Members of civil society organizations, for example, including Tanzania’s active parent-teacher organizations, can act as intermediaries, printing out information about school performance to share on a community notice board or at meetings, for example.27

Data quality and diversity

The combination of Education Open Data Dashboard and Shule increased the diversity and thus the usefulness of available data on education in Tanzania. Taken together, the information they provided is richer and more interesting than either site would have been on its own (or, of course, than the pre-existing lack of data). Education Open Data Dashboard offered indicators such as pupil-teacher ratios, regional and district rankings, and improvement rankings over time, all of which are navigated via a clickable map and drop-down menu of schools. Shule captured a much longer span of data, with examination results going back to 2004. In addition to results by gender, Shule offered average performance over time, instead of Education Open Data Dashboard’s simple pass rate, and looked at the breakdown of candidate numbers per grading division over time. It also modeled the effect of the 2012 grading revision to examine how it changed candidate pass rates.

Although based on government data, the dataset used to build Shule is not completely identical to that used for the government dashboard; this is due to differences in methods of data collection. Perhaps as a result, Shule’s figures can depart in significant ways from the government version. For example, NECTA traditionally published an annual list of the ten government and secondary schools with the highest examination results. In 2012, Minde reports that NECTA's official list contained a number of government schools, but Shule’s analysis showed that all ten of the top performing schools were private.

For the developers of Education Open Data Dashboard, one of the more surprising discoveries was that feeding a dashboard was a potent incentive to compliance with data reporting. Regional officials and head teachers were excited by finding their school or region in the dashboard, and by seeing what the data they submitted was creating, and this excitement appeared to translate to improved reporting, at least in the short term.28 This suggests that the novelty of open data use and data visualization can be a useful tool in improving data quality.

Spillover effects on other open data projects

As the developers of the latest version of Educationdashboard have indicated, Shule forms part of a nascent data ecosystem of which they were very much aware during the development and refinement of their own site. For government officials involved in creating the dashboard, the existence of such independent projects validated both the demand for the kinds of open data portal they were building, and provided evidence that the local technical and other capacity existed to build it.29 Their own dashboard was, in turn, a powerful tool in demonstrating the potential and uses of open data to a non-technical audience, particularly among policymakers. In addition, the data visualizations and linkages it made possible ignited interest in, and impetus for, the development of dashboards in other sectors, such as moves by the Department of Justice to map courthouses across the country.30

Read More

Shule and Education Open Data Dashboard were both experimental projects, launched into a society that was just beginning to grasp the potential of open data. If projects like these are to succeed, they will need to overcome significant societal challenges. This section examines some of the most important enablers of and challenges to these projects. Although these enablers and barriers are particular to this project, they offer hints of what may face other open data projects in other developing countries.

Enablers

Leveraging Intermediaries

As Internet penetration slowly expands in Tanzania, civil society organizations like parent- teacher organizations or NGOs have an important role to play as intermediaries that can disseminate insights gleaned from open data among citizens who would otherwise not have access to the data. The developers of Educationdashboard note that ultra-low-tech solutions like posting printouts of information drawn from open data dashboards on school or community noticeboards can be effective in getting information to the people who can use it.31 The focus on easily comprehensible data visualizations also made such low-tech solutions possible.

Engaging Civil Society

Even among such intermediary groups, however, awareness of the potential of open data remains nascent at best. Like the public at large, civil society groups also need to be trained to analyze and visualize data. Some efforts have taken place in Tanzania to involve civil society: in 2012, in an effort to encourage interest and build skills among coders and the media, the World Bank Institute and the Africa Media Initiative combined to offer the Data Bootcamp in Dar-es-Salaam.32 A similar initiative was offered by Twaweza in 2013, and community groups such as the Open Knowledge Foundation Network TZ have attempted to promote open data meetups in Dar-es-Salaam. Thus far the work has been mostly carried forward by local civil society organizations like Twaweza and REPOA, but international development organizations already operating in Tanzania would be well placed to assist them. As is the case across many of the case studies in this series, the existence of a strong ICT4D and D4D ecosystem cleared the way for these new and innovative open data uses.

Barriers

Internet Penetration

Perhaps the most important challenge stems from Tanzania’s low Internet penetration and usage rates. The two dashboards begin from the premise that providing information to target audiences will improve conditions on the ground. However, given Tanzania’s low Internet penetration rates, particularly in rural areas, where Internet penetration is estimated to be about a quarter of that in urban areas,33 getting information to those target audiences remains a challenge. This clearly limits the reach of education-related data, and open data more broadly. Furthermore, of the 4.7 percent of Tanzanians who used the Internet in 2014, the great majority did so only by mobile phone; only 0.17 percent of Tanzanians had a fixed broadband subscription.34 In order to appeal more widely, any open data site clearly needs to consider launching a mobile application to appeal to “the retail user of data sitting in a bus shelter with a mobile phone.”35

This is a challenge faced by data projects throughout the developing world, and some have dealt with it by developing low-cost, low-bandwidth solutions more accessible to users on slow mobile connections.36 In some cases, too, sharing information over SMS has proven effective.37

Public Interest and Trust in Technology

Although technology remains inherently a challenge in the developing world, the barriers may be even higher when it comes to using technology (and data) as instruments of social change. Minde notes that, in general, the Tanzanian public is deeply unfamiliar with the potential of the Internet, and perhaps not yet inclined to trust it. He adds that Tanzanians have yet to embrace or commit to digital solutions for the problems of everyday life, whether complex or mundane. As an example, he cites the difficulty he experienced in convincing bus operators to adopt an earlier application he developed that allowed passengers to purchase tickets by phone. “It will only take one [company], and then people will see the benefit,” he says. “But first you have to convince the one.”38

Read More

Current Status

Education Open Data Dashboard displays data visualizations for data only from 2012 to 2014. Given that education data for 2016 is now available on the Tanzanian government open data portal, opendata.go.tz, it appears that the site is no longer being actively updated and may have reached the end of its lifespan.

Similarly, Shule.info has not had any results added since 2013. Although Minde says he contemplated further refinements to his project (including adding Form 4 examination results39 and an increased range of information about schools),40 the dashboard should probably now be considered dormant.

Although the short lifespans of these projects make clear the difficulty in sustaining open data projects over the long term absent a clear business model or operational strategy for engaging target audiences, their impact has nonetheless been undeniable and both projects offer valuable insights for open data projects across the developing world.

Sustainability

Projects by sole developers, such as Shule.info, are inherently vulnerable as the developer’s available time, energy, and interest in the project change. Minde has indicated that the biggest constraint on Shule’s growth was his own time.41 As a government site, Education Open Data Dashboard should have had greater longevity, but even it was unable to sustain itself. The fact that neither was driven by end-user demand could also have made them more vulnerable to abandonment. Indeed, this appears to have been the case: although Minde says that he is still convinced of the usefulness of and need for the data, there were no demands for updates to it, and he was unable to obtain the necessary investment to build Shule into a commercial product to ensure its long-term sustainability.42

Moreover, given low Internet penetration rates, the existence of two separate dashboards for education information could also prove confusing to parents, and limit the effectiveness of both platforms. Greater impact could perhaps have come from integrating the two platforms and cooperatively advancing a single project, rather than providing a limited user base with two separate entry points for accessing essentially the same information. It is worth noting that moves toward greater coordination were in fact made, notably including Minde’s involvement in development strategy meetings for Education Open Data Dashboard.43 However, these efforts at coordination do not appear to have yielded the desired results.

Replicability

These dashboards illustrate the power of a deceptively simple tool, that can be built locally in a matter of a few weeks by a single developer (Shule.info) or a small team (Education Open Data Dashboard), with little or no outside support or funding, then refined through user feedback. As one of the developers of the Education Open Data Dashboard put it: “Get a minimum viable product [MVP] out there. Make some assumptions about the data, get it out there, and provoke a response.”44 So whether or not the specific tools or methods used by the developers of the platforms are replicated, their general approach—drawing on open data to quickly create platforms aimed at bettering the public good—can be seen as inspiration for similarly community-minded innovators across developing countries.

Read More

While neither Shule nor Education Open Dashboard was able to achieve longer-term sustainability or the types of transformative impact on education and parent decision-making that they set out to accomplish, they can be seen as clear indications of how dedicated, data-driven efforts to enhance citizen decision-making and benefit the public good can quickly become tangible. Indeed, the projects also make clear the need for a longer-term business model to ensure that initial MVPs grow into “sticky,” widely used platforms—a key lesson for the field of open data practice.

Read More

Reference

1 . Project conducted in collaboration with the Web Foundation, United States Agency for International Development (USAID), and the Mobile Solutions, Technical Assistance and Research (mSTAR) program at FHI 360.

2 . This case study builds on and updates a previous piece drafted as part of the GovLab and Omidyar Network Open Data’s Impact initiative.

3 Special thanks to Akash Kapur who provided crucial editorial support for this case study, and to the peer reviewers who provided input on a pre-published draft.

4 . Frank Kimboy, “High Pass Rate Greeted as Good as Well as Bad News,” The Citizen, July 23, 2014, http://www.thecitizen.co.tz/magazine/politicalreforms/High-pass-rate-greeted-as-good/1843776-2394162-14jmnxhz/index.html.

5 . UNESCO, “World Data on Education,United Republic of Tanzania,” 2010, http://www.ibe.unesco.org/fileadmin/user_upload/Publications/WDE/2010/pdf-versions/United_Republic_of_Tanzania.pdf.

6 . World Bank, World DataBank, “Tanzania,” http://databank.worldbank.org/data//reports.aspx?source=2&country=TZA&series=&period=

7 . Elisha Mangolanga, “No More Div. Zero as Government Guts National Grading System,” The Citizen, November 1, 2013, http://www.thecitizen.co.tz/News/Govt-in-major-change-of-national-exam-grading/1840340-2055404-n8mhil/index.html.

8 . Frank Kimboy, “High Pass Rate Greeted as Good as Well as Bad News,” The Citizen, July 23, 2014, http://www.thecitizen.co.tz/magazine/political-reforms/High- pass-rate- greeted-as- good/-/1843776/2394162/-/umh9xl/-/index.html.

9 . The Citizen Reporter, “Teacher Shortage Hurtiing Tanzania,” The Citizen, October 14, 2014, http:/ http://www.thecitizen.co.tz/News/Teachers-shortage-hurting-Tanzania/1840340-2485582-3ktjd2z/index.html.

10 . Jacob Kushner, “Tanzanian teachers learning that education doesn’t pay,” PRI, December 20, 2013, https://www.pri.org/stories/2013-12-20/tanzanian-teachers-learning-education-doesnt-pay.

11 . Freedom House, “Tanzania,” https://freedomhouse.org/country/tanzania#.VaQZFvlViko.

12 . Reporters sans Frontieres, “Tanzanie,” http://index.rsf.org/#!/index-details/TZA.

13 . Freedom House, “Freedom of the Press: Tanzania,” 2011, https://freedomhouse.org/report/freedom-press/2011/tanzania#.VaARQ_lVikp.

14 . Open Data Barometer, “Data and Analysis: Clusters,” Web Foundation, http://www.opendatabarometer.org/report/analysis/index.html

15 . Open Government Partnership, “Tanzania, 2014-15 Action Plan Documents,” 2015, http://www.opengovpartnership.org/country/tanzania/action-plan.

16 . Available at: http://www.necta.go.tz/opendata/, and subsequently updated at: http://www.necta.go.tz/opendata/brn/.

17 . Available at: http://educationdashboard.org/#/.

18 . See: http://www.shule.info/about.

19 . GovLab Interview with Arnold Minde, July 9, 2015.

20 . Ibid.

21 . International Telecommunication Union, “ICT Facts and Figures,” http://www.itu.int/en/ITU-D/Statistics/Pages/stat/default.aspx.

22 . GovLab Interview with Arnold Minde, July 9, 2015.

23 . Ibid.

24 . Ibid.

25 . Ibid.

26 . Michael Bauer, “The Data Bootcamp in Tanzania,” October 25, 2012, Open Knowledge International Blog, http://blog.okfn.org/2012/10/25/the-data-bootcamp-in-tanzania/.

27 . GovLab interview with Samhir Vasdev and Verena Luise Knippel, June 30, 2015.

28 . Ibid.

29 . Ibid.

30 . Open Data for Africa, “Tanzania Data Portal,” November 22, 2013, http://tanzania.opendataforafrica.org/igcpumb/social-justice.

31 . GovLab Interview with Samhir Vasdev and Verena Luise Knippel, June 30, 2015.

32 . Michael Bauer, “The Data Bootcamp in Tanzania,” October 25, 2012, Open Knowledge International Blog, http://blog.okfn.org/2012/10/25/the-data-bootcamp-in-tanzania/.

33 . Africa Focus, “Tanzania: Old media, new media,” AfricaFocus Bulletin, April 5, 2011, http://www.africafocus.org/docs11/tan1104.php.

34 . International Telecommunication Union, “ICT Facts and Figures,” http://www.itu.int/en/ITU-D/Statistics/Pages/stat/default.aspx.

35 . GovLab Interview with Aidan Eyakuze, July 14, 2015.

36 . See, for example: http://www.aptivate.org/webguidelines/Why.html.

37 . See, for example: Participedia, “Enabling Youth Participation through Technology: U-report Uganda, June 21, 2016, http://participedia.net/en/cases/enabling-youth-participation-through-technology-u-report-uganda.

38 . GovLab Interview with Arnold Minde, July 9, 2015.

40 . GovLab Interview with Arnold Minde, July 9, 2015.

41 . GovLab Interview with Arnold Minde, September 20, 2016.

42 . Ibid.

43 . GovLab Interview with Samhir Vasdev and Verena Luise Knippel, June 30, 2015.

44 . Ibid.

close