The Global Impact of Open Data
New Zealand's Christchurch Earthquake Clusters
Open Data for Improving Emergency Response
by Juliet McMurren, Stefaan Verhulst and Andrew Young*
In 2010 and 2011, the city of Christchurch, New Zealand’s third largest, with a population of 375,000, experienced a series of devastating earthquakes. On September 4, 2010, a magnitude 7.1 quake caused widespread property damage and minor injuries, but no deaths.18 Nearly six months later, on February 22, 2011, before the city had fully recovered from the first earthquake, it experienced a second severe quake. While weaker in magnitude than the first and a mere 12 seconds long, an unlucky combination of factors – shallow depth, steep angle, and an epicenter located a mere 10 kilometers from the city center19 meant that the second earthquake produced some of the most intense and violent shaking ever recorded in an urban area. Peak ground acceleration during the earthquake approached 2g in parts of central Christchurch20 (as compared to 0.5g in the 2010 Haiti earthquake), and eyewitness accounts reported people literally being thrown into the air.21
Julian Carver, former CIO of the Canterbury Earthquake Recovery Authority (CERA), describes the experience of the earthquake:
“February 22nd 2011, 12:51 p.m., I’m working from home, lying on my bed, reading email on my iPhone. Thirty seconds later, my city, my life, and my future had changed irrevocably. Anything not bolted down was on the floor and half of it was smashed. Computer monitors, TVs, bookshelves, food from the fridge. The power went off, then stayed off for five days. Mobile calls worked for a few minutes, then failed. Texts became patchy after an hour. The only thing that was semi-reliable was Twitter over 3G.”22
The quake caused significant structural damage to the city’s already weakened buildings. The country’s strict building codes and the mercifully short duration of the quake limited the damage,23 but 185 people were killed, half of them in a single building collapse, in what was New Zealand’s second-deadliest recorded natural disaster. As of April 2013, the cost of rebuilding stood at $40 billion NZD.24
The recovery was significantly aided by a number of projects making innovative use of open data, open source tools, crowdsourcing and trusted data sharing. These tools, which we describe below, were developed in a highly agile and iterative manner. They allowed the city to recover rapidly and cheaply; together, they suggest the tremendous potential of innovation and data-driven projects in the midst of a crisis and as responses to natural and other disasters.25
Canterbury Recovery Map (Eq.org.nz)
Immediately after the 2011 earthquake, significant parts of the city were without water or sewerage for up to three weeks, since up to 80 percent of the city’s below-ground infrastructure had been damaged.26 Roads in some parts of the city were inaccessible because of damage or soil liquefaction, and normal channels of communication were significantly disrupted by power outages. One of the most immediate problems was a lack of information, as residents tried to work out where to go for essential goods and services. Official sources did exist: A cloud-hosted emergency information website (canterburyearthquake.govt.nz) had been set up immediately after the earthquake,27 when it became apparent that the City Council servers were not up to the task of handling demand for emergency information because of power outages, building damage, and inadequate capacity. However, this website didn’t have mapping capabilities, and depended on a small, overworked team – “four people sitting around a trestle table with laptops,” according to Carver28 – physically located inside the emergency operations center in the heavily damaged city center.29
Within hours of the quake, a group of skilled volunteers in New Zealand and overseas responded to these shortcomings by using Ushahidi, an open source disaster response platform30 using open map data that had been successfully deployed after the Haiti quake, to create Eq.org.nz, a crowdsourced disaster map.31
The site helped residents navigate the post-earthquake urban environment by crowdsourcing information about damage, road closures, and the availability of essential supplies and services, and offers or requests for help.32 At the time, Tim McNamara, one of the Eq.org.nz leads, summed up the project: “We’re asking people to tell us where they are and what they see – if roads are blocked, which [store] is open, which [hardware store] is open, which medical center, where there are phones working and Internet access.”33 Contributors could enter information on a website form, or via email, SMS code, or Twitter with hashtags #eqnz or #helpme for emergency requests.34 Human curators categorized every incoming message that contained both a fact and a location, and plotted it on a map. Eq.org.nz’s volunteers were able to verify, categorize and publish reports within five minutes of receipt of a new message. The data was published via an open Web application programming interfacenomonstrated that a Set: Consolidating and Freeing Up Address Data.”.”oss the case studies will be released over the next two mo(API) that allowed third parties, including Environment Canterbury, to combine the site’s information with their own data.35
By February 24, 2011, two days after the earthquake, the site had amassed 779 reports, 781 different locations, and almost 70,000 unique visitors.36 It also helped inform the activities of local volunteers such as the Student Army and Farmy Army, which provided thousands of volunteers to help clear more than 360,000 tons of silt deposited by liquefaction from residential properties, over more than 80,000 volunteer working hours.37 The Ushahidi volunteers reported feedback from users such as a Christchurch diabetic, who thanked them for telling her where she could get insulin.38 The site was active for three weeks after the earthquake, until power and normal channels of communication were fully restored.
GIS and Trusted Data Sharing
In the immediate aftermath of the second earthquake, officials responsible for GIS data at Christchurch City Council and Environment Canterbury found themselves overwhelmed with demands from Civil Defence and emergency services for maps to help with search and rescue and other emergency response.39 Requests quickly outstripped their capacity, and the team knew that it needed to call in outside help. Ultimately, they found solutions in various data-sharing initiatives.
Volunteer teams from the Wellington City Council and Greater Wellington Regional Council, and Eagle Technology, a Wellington-based IT firm offering open systems and GIS platforms, had all offered help, but the traditional solution – mailing data on DVD or hard drive to the Wellington volunteers – was too slow. The Christchurch GIS data team obtained permission to open their data so that it could be freely used under a Creative Commons license, enabling the Wellington teams to produce maps to help with emergency response.40 Static data, including aerial imagery of Christchurch taken within 48 hours of the quake, was uploaded to, and made freely available from the geodata distributor Koordinates.com,41while dynamic data was made available to the emergency mapping data teams via open geospatial standards.42
Similar data sharing occurred after the establishment of CERA. Having been set up on a relatively ad hoc basis six weeks after the second earthquake, CERA’s office and IT solutions were basic, and had no mapping, GIS, or data functionality. Carver, the acting CIO, approached Land Information New Zealand (LINZ) for assistance with GIS data infrastructure: “They said, we’ve got a set of those services we could spin up for you, and then feed in all of the open data from LINZ data services, and that would get you started.”43 Having established CERA’s mapping capacity, Carver began to get requests for help from the Christchurch City Council, which was facing heavy demands generating maps for CERA demolition crews working in the central city. Christchurch City Council provided CERA with a list of all of its data sets that it could open up as data services, which was then prioritized by CERA. The data was then opened through open or secure data feeds, and the CERA GIS team was able to do analysis and make maps for the Christchurch City Council.44
This began a pattern of GIS data sharing and opening between the earthquake recovery agencies. As Carver put it:
“It was a New Zealand-scale, Christchurch-scale [solution]. You could get the four or five people … who understood the need, understood what users wanted, had the technical understanding and had the authority to make it happen … in a room, every two weeks, [saying] OK, now we need to add this, or change this, or open this up. ... It was very agile, very iterative.”45
Landcheck and My Property
By late June 2011, the Canterbury Earthquake Recovery Authority had completed its geotechnical assessment and zoning of residential property to indicate the level of risk for a given area in the event of an earthquake. Now it needed a way to communicate those zoning decisions to the people of Christchurch. As Carver recalled in a blog post: “Like everything in the recovery, time frames were tight. People want government decisions to be based on sound scientific and economic evidence. They also want to know where they stand (and can live), as soon as possible. CERA needed a way to let people see exactly which zone their house was in. That required an interactive website, capable of taking a massive initial load, which would be implemented in a very short time frame.”46
The solution was a partnership between the engineering firm responsible for creating the earthquake zoning maps, and Trade Me, New Zealand’s largest online auction site. Carrying out the work pro bono, Trade Me built the Landcheck47 site using open property and address data in four days, using their server farms in Auckland and Wellington. Carver reports that the site received 2 million page views in the first hour, and 5 million page views and 3.3 million individual property searches on the first day.48
Three months later, in October 2011, Landcheck was replaced by My Property,49as CERA made public the results of citywide geotechnical studies. My Property allowed residents to check not only the zoning of their property, but also the technical category of the land, which defined how it was expected to perform in future earthquakes, and the foundation type required for new construction.50 The technical category maps on My Property were built on the same GIS viewer and open data as had been used for Landcheck, incorporating photographs, maps, zoning, and technical category data.51 Although Carver notes it would be difficult to place a monetary value on the benefit provided by these sites, they were an essential public service that was widely accessed by the public, giving assurance to citizens about the safety of their property as aftershocks continued, and authoritative information about the legal context for repairs and rebuilds.52
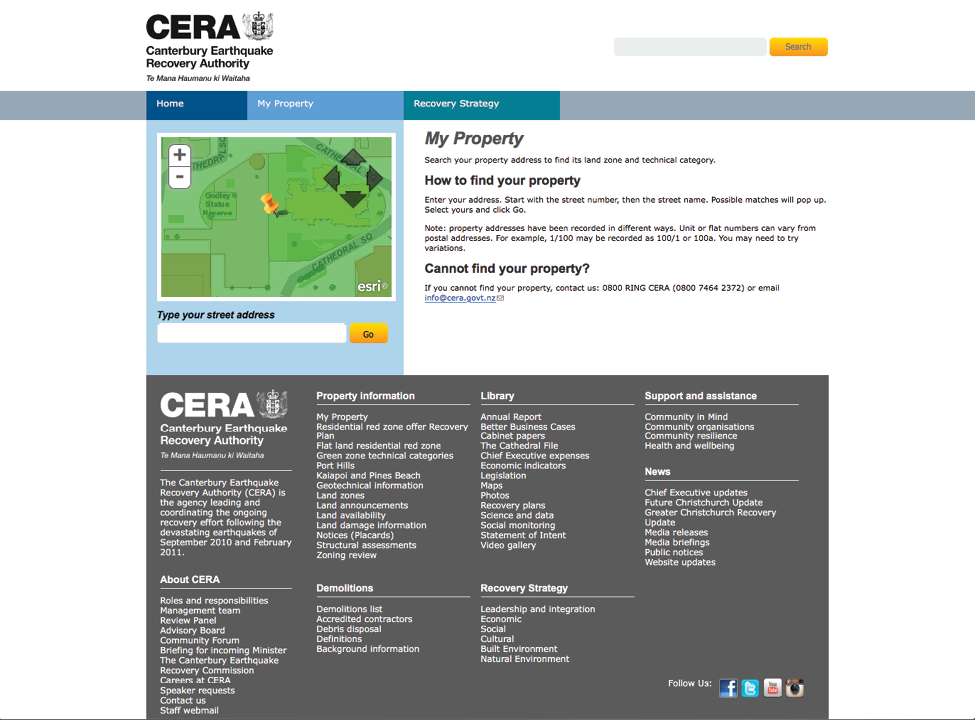
Figure 1. My Property Main Page
Forward Works Viewer
During the repair and rebuild of the central city, which had been badly damaged by the February 2011 earthquake, CERA found itself tasked with the near-impossible: demolishing 1,200 commercial buildings, repairing all below-ground infrastructure (wastewater, stormwater, water supply, power, and broadband), and beginning the process of reconstructing new buildings, all within a small geographic area, at the same time. In an interview, Carver said that “the only way of viably doing that [was to enable] everyone to see everyone else’s forward construction intentions well enough in advance to avoid expensive clashes and delays.”53
LINZ, CERA, and the other agencies coordinating the Canterbury rebuild responded with the Forward Works Viewer, a tool which gave those agencies and other public and private sector users a shared online view of horizontal infrastructure repair, planned buildings, and other construction.54 The viewer allowed users to manage and view projects and their impacts spatially and over time, and detect potential clashes and opportunities for collaboration.55
The development of Forward Works, which was carried out using the agile software development methodology Scrum, was subcontracted to companies with geospatial, engineering and Web development expertise.56 The site drew heavily on open property and road network data, open source tools, and open geospatial standards.57 The open public road network data, however, had significant limitations, according to Carver.
“The road network data was simply road center-line … and didn’t tell you anything about lanes, directions, turns, and turn restrictions. We wanted to be able to build those things into Forward Works’ viewer because we wanted to be able to assess impact on the road network of vertical construction or road closures due to road repair. Is it this lane, or this lane? Is it total closure or reduced capacity? That was quite important to know for traffic modelling, but we didn’t have an open, freely reusable, routable roading network.”58
The solution was to contract four postgraduate GIS students for two weeks to bring OpenStreetMap for the relevant area fully up to date, at a cost of NZ$10,000, and make it fully routable for Christchurch. They then integrated this data into the Forward Works viewer with an impact selector to enable planners to choose the best lane for closures.59
The total cost of constructing the Forward Works viewer was NZ$1.6 million. A LINZ assessment in 2014 showed that the Forward Works viewer had delivered NZ $4 million in benefits since its launch in 2013, with a total of more than NZ$20 million forecast.60 These benefits were the result of cost savings in reduced clashes and delays, shared roadworks and trenching, reduced impact on the travelling public and traffic modelling that allowed twice as many closures within the central city while maintaining the same traffic flows.61
Building Our Footprints
During the recovery, the agencies involved in rebuilding had identified deficits in some of the geospatial and property data sets. Residential building footprint databases did not exist for the satellite municipalities of Selwyn and Waimakariri, and the Christchurch data set was incomplete, with potential consequences for emergency response and rebuilding. In 2014, Jeremy Severinson, a LINZ employee who had been conducting postgraduate research assessing the trustworthiness of crowdsourced data at the University of Canterbury, approached Environment Canterbury with an idea.62
Severinson proposed crowdsourcing the creation of a database, in the form of a competition for school students. “Building Our Footprints” was run by Environment Canterbury in collaboration with LINZ and the University of Canterbury. Environment Canterbury created a Web app63 with instructions, registration, and login for participants, who digitized building outlines from open aerial photographs, attempting to achieve a trust metric above 75 percent. The first participant to achieve 75 percent or better was awarded the point for that building, and the participant with the greatest number of points won. LINZ provided a small amount of sponsorship for prizes, in the form of an iPad Mini for the eventual winner, cash, and movie tickets.64 The competition ran for a month and generated 18,789 building outlines,65 which were integrated into the relevant council databases and OpenStreetMap.66
Carver admits that this competition was done “for fun, because we wanted to see what would work in terms of solving problems. ... Just as importantly, we got a bunch of kids, who might not have considered spatial or open data or technology … in their careers, engaged with that. So it was … just a little ‘Let’s see what happens!’ exemplar – and it worked really well.”67 Iain Campion is also enthusiastic about the competition: “We were quite keen on it, not just for the building footprints, but to give us an insight on how we could use … the crowd for our other data sets, like water quality.”68
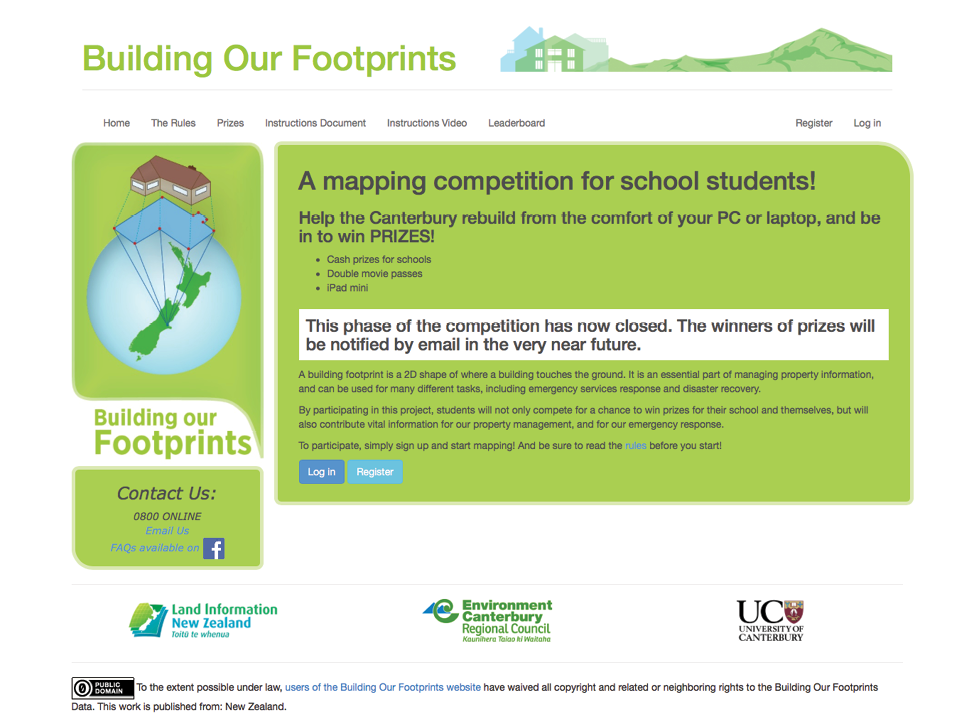
Figure 2. Building Our Footprints Main Page
Campion concedes, however, that not all of the objectives of the competition were met. Map areas were not randomly assigned, but were chosen by the participants, with the result that most chose the area in which they lived. The majority of participants came from a handful of schools within Christchurch itself, so the competition generated fewer building outlines from outlying towns, and duplicated some outlines already held by Christchurch City Council. The overall quality of the data, however, was good, and the cost per outline was a mere NZ$0.02.69
Read MoreReference
5 https://en.wikipedia.org/wiki/List_of_earthquakes_in_New_Zealand#Earthquakes_resulting_in_fatalities
14 https://www.ict.govt.nz/guidance-and-resources/open-government/declaration-open-and-transparent-government/
15 https://www.ict.govt.nz/guidance-and-resources/open-government/new-zealand-government-open-access-and-licensing-nzgoal-framework/
18 http://web.archive.org/web/20100905033623/http://earthquake.usgs.gov/earthquakes/recenteqsww/Quakes/us2010atbj.php; “Why so few casualties in Canterbury quake?” Stuff.co.nz. September 4, 2010. http://www.stuff.co.nz/national/4096813/Why-so-few-casualties-in-Canterbury-quake
19 Office of the Prime Minister’s Science Advisory Committee. “The Canterbury Earthquakes: Scientific answers to critical questions.” The Royal Society of New Zealand. 2011. http://www.royalsociety.org.nz/media/Information-paperThe-Canterbury-Earthquakes.pdf
20Campbell, Hamish. “Technically it’s just an aftershock.” New Zealand Herald. February 24, 2011. http://www.nzherald.co.nz/opinion/news/article.cfm?c_id=466&objectid=10708275
21 Lin II, Rong-Gong and Sam Allen. “New Zealand quake raises questions about L.A. buildings.” Los Angeles Times. February 26, 2011. http://www.latimes.com/local/la-me-quake-california-20110226-story.html
22 Carver, Julian. “Using the Web in Earthquake Recovery.” New Zealand Government Web Toolkit. March 25, 2013. https://webtoolkit.govt.nz/blog/2013/03/using-the-web-in-earthquake-recovery/
23 Clifton, Charles. “Christchurch Feb 22nd Earthquake: A Personal Report by Charles Clifton – March 2011.” HERA. March 2011. http://www.hera.org.nz/Story?Action=View&Story_id=1398
24 GovLab interview with Julian Carver, former Chief Information Officer, Canterbury Earthquake Recovery Authority, August 3, 2015.
25 GovLab interview with Julian Carver, former Chief Information Officer, Canterbury Earthquake Recovery Authority, August 3, 2015.
26 Clifton, Charles. “Christchurch Feb 22nd Earthquake: A Personal Report by Charles Clifton – March 2011.” HERA. March 2011. http://www.hera.org.nz/Story?Action=View&Story_id=1398
27 McNamara, Tim. “Eq.org.nz – The Power of Ushahidi.” Institute of IT Professionals TechBlog. March 18, 2011. http://techblog.nz/94-eqorgnzThePowerofUshahidi
28 GovLab interview with Julian Carver, former Chief Information Officer, Canterbury Earthquake Recovery Authority, August 3, 2015.
29 McNamara, Tim. “Eq.org.nz – The Power of Ushahidi.” Institute of IT Professionals TechBlog. March 18, 2011. http://techblog.nz/94-eqorgnzThePowerofUshahidi
30 Carver, Julian. “Using the Web in Earthquake Recovery.” New Zealand Government Web Toolkit. March 25, 2013. https://webtoolkit.govt.nz/blog/2013/03/using-the-web-in-earthquake-recovery/
31 Bell, Stephen. “Tech volunteers quick to help in quake aftermath.” Computerworld. February 24, 2011. http://www.computerworld.co.nz/article/498626/tech_volunteers_quick_help_quake_aftermath/
32 GovLab interview with Julian Carver, former Chief Information Officer, Canterbury Earthquake Recovery Authority, August 3, 2015.
33 Bell, Stephen. “Tech volunteers quick to help in quake aftermath.” Computerworld. February 24, 2011. http://www.computerworld.co.nz/article/498626/tech_volunteers_quick_help_quake_aftermath/
34 Bell, Stephen. “Tech volunteers quick to help in quake aftermath.” Computerworld. February 24, 2011. http://www.computerworld.co.nz/article/498626/tech_volunteers_quick_help_quake_aftermath/
35 McNamara, Tim. “Eq.org.nz – The Power of Ushahidi.” Institute of IT Professionals TechBlog. March 18, 2011. http://techblog.nz/94-eqorgnzThePowerofUshahidi
36 Meyer, Patrick. “Launching Eq.org.nz for the New Zealand Earthquake.” Ushahidi. February 24, 2011. http://www.ushahidi.com/blog/2011/02/24/launching-eq-org-nz-for-the-new-zealand-earthquake/
37 “September 2010 Christchurch Earthquake.” Volunteer Army Foundation. http://www.volunteerarmy.org/history/
38 Meyer, Patrick. “Launching Eq.org.nz for the New Zealand Earthquake.” Ushahidi. February 24, 2011. http://www.ushahidi.com/blog/2011/02/24/launching-eq-org-nz-for-the-new-zealand-earthquake/
39 Carver, Julian. “Open_Data_Mini_Case_Studies.” Open New Zealand. February 6, 2013. https://wiki.open.org.nz/wiki/display/main/Open_Data_Mini_Case_Studies#Open_Data_Mini_Case_Studies-OpenDataSupportsEmergencyOperations
40 Carver, Julian. “Open_Data_Mini_Case_Studies.” Open New Zealand. February 6, 2013. https://wiki.open.org.nz/wiki/display/main/Open_Data_Mini_Case_Studies#Open_Data_Mini_Case_Studies-OpenDataSupportsEmergencyOperations
42 Carver, Julian. “Open_Data_Mini_Case_Studies.” Open New Zealand. February 6, 2013. https://wiki.open.org.nz/wiki/display/main/Open_Data_Mini_Case_Studies#Open_Data_Mini_Case_Studies-OpenDataSupportsEmergencyOperations
43 GovLab interview with Julian Carver, former Chief Information Officer, Canterbury Earthquake Recovery Authority, August 3, 2015.
44 GovLab interview with Julian Carver, former Chief Information Officer, Canterbury Earthquake Recovery Authority, August 3, 2015.
45 GovLab interview with Julian Carver, former Chief Information Officer, Canterbury Earthquake Recovery Authority, August 3, 2015.
46 Carver, Julian. “Using the Web in Earthquake Recovery.” New Zealand Government Web Toolkit. March 25, 2013. https://webtoolkit.govt.nz/blog/2013/03/using-the-web-in-earthquake-recovery/
48 GovLab interview with Julian Carver, former Chief Information Officer, Canterbury Earthquake Recovery Authority, August 3, 2015.
51 GovLab interview with Stephen Ferris, GIS and Data Manager, Canterbury Earthquake Recovery Authority, September 22, 2015.
52 GovLab interview with Julian Carver, former Chief Information Officer, Canterbury Earthquake Recovery Authority, August 3, 2015.
53 GovLab interview with Julian Carver, former Chief Information Officer, Canterbury Earthquake Recovery Authority, August 3, 2015.
54 “Online tool enhances Canterbury rebuild.” Land Information New Zealand. July 29, 2014. http://www.linz.govt.nz/news/2014-07/online-tool-enhances-canterbury-rebuild
55 “Forward Works Viewer.” Media Suite. https://www.mediasuite.co.nz/forward-works.php
56 “Forward Works Viewer.” Media Suite. https://www.mediasuite.co.nz/forward-works.php
57 GovLab interview with Julian Carver, former Chief Information Officer, Canterbury Earthquake Recovery Authority, August 3, 2015.
58 GovLab interview with Julian Carver, former Chief Information Officer, Canterbury Earthquake Recovery Authority, August 3, 2015.
59 GovLab interview with Julian Carver, former Chief Information Officer, Canterbury Earthquake Recovery Authority, August 3, 2015.
60 “Online tool enhances Canterbury rebuild.” Land Information New Zealand. July 29, 2014. http://www.linz.govt.nz/news/2014-07/online-tool-enhances-canterbury-rebuild
61 GovLab interview with Julian Carver, former Chief Information Officer, Canterbury Earthquake Recovery Authority, August 3, 2015.
62 GovLab interview with Iain Campion, former Application Team Leader, Environment Canterbury, July 28, 2015.
66 GovLab interview with Julian Carver, former Chief Information Officer, Canterbury Earthquake Recovery Authority, August 3, 2015.
67 GovLab interview with Julian Carver, former Chief Information Officer, Canterbury Earthquake Recovery Authority, August 3, 2015.
68 GovLab interview with Iain Campion, former Application Team Leader, Environment Canterbury, July 28, 2015.
69 GovLab interview with Iain Campion, former Application Team Leader, Environment Canterbury, July 28, 2015.
70 McNamara, Tim. “Eq.org.nz – The Power of Ushahidi.” Institute of IT Professionals TechBlog. March 18, 2011. http://techblog.nz/94-eqorgnzThePowerofUshahidi
71 McNamara, Tim. “Eq.org.nz – The Power of Ushahidi.” Institute of IT Professionals TechBlog. March 18, 2011. http://techblog.nz/94-eqorgnzThePowerofUshahidi
72 GovLab interview with Julian Carver, former Chief Information Officer, Canterbury Earthquake Recovery Authority, August 3, 2015.
73 GovLab interview with Iain Campion, former Application Team Leader, Environment Canterbury, July 28, 2015.
74 GovLab interview with Julian Carver, former Chief Information Officer, Canterbury Earthquake Recovery Authority, August 3, 2015.
75 GovLab interview with Julian Carver, former Chief Information Officer, Canterbury Earthquake Recovery Authority, August 3, 2015.
76 GovLab interview with Julian Carver, former Chief Information Officer, Canterbury Earthquake Recovery Authority, August 3, 2015.
77 GovLab interview with Iain Campion, former Application Team Leader, Environment Canterbury, July 28, 2015.
78 GovLab interview with Julian Carver, former Chief Information Officer, Canterbury Earthquake Recovery Authority, August 3, 2015.
79 GovLab interview with Julian Carver, former Chief Information Officer, Canterbury Earthquake Recovery Authority, August 3, 2015.
80 GovLab interview with Iain Campion, former Application Team Leader, Environment Canterbury, July 28, 2015.
81 McMurren, Juliet, Stefaan Verhulst and Andrew Young. “Denmark’s Open Address Data Set: Consolidating and Freeing Up Address Data.” Open Data’s Impact. January 2016. http://odimpact.org/case-denmarks-open-address-data-set.html
82 GovLab interview with Julian Carver, former Chief Information Officer, Canterbury Earthquake Recovery Authority, August 3, 2015.
83 GovLab interview with Julian Carver, former Chief Information Officer, Canterbury Earthquake Recovery Authority, August 3, 2015.
84 http://m.stats.govt.nz/about_us/what-we-do/our-publications/cabinet-papers/data-futures-partnership-cabinet-paper
85 GovLab interview with Julian Carver, former Chief Information Officer, Canterbury Earthquake Recovery Authority, August 3, 2015.
86 GovLab interview with Julian Carver, former Chief Information Officer, Canterbury Earthquake Recovery Authority, August 3, 2015.
87 Carver, Julian. “Using the Web in Earthquake Recovery.” New Zealand Government Web Toolkit. March 25, 2013. https://webtoolkit.govt.nz/blog/2013/03/using-the-web-in-earthquake-recovery/